Changelog
A peek into what's been going on in the OtterWise product development department. We publish changelogs for even the smaller updates, in an effort to stay transparent.
Fixed: Uploading an empty LCOV coverage report (one where the test run covered no files) would fail to process. These reports are now accepted and recorded correctly.
Fresh look and Dark Mode
Our whole app has gotten a visual refresh, including support for Dark Mode. This is a purely visual update — no functionality has changed, everything works exactly as it did before.
Dark Mode automatically follows your system/browser preference, so there is nothing to toggle.
This is still being tested, so if you run into anything that looks off or have any feedback, please let us know. We appreciate any and all findings.
Added search to the branch selector on the repository page, making it much easier to find the right branch on repositories with many branches.
Quick search with ⌘K / Ctrl+K
Added a quick search you can open anywhere in the app with ⌘K (Mac) or Ctrl+K (Windows/Linux). Start typing to instantly jump to any of your organizations, any repository across all your organizations, or common pages like Reporting, Billing, Settings and Team — only showing what you have access to.
Improved the reliability and speed of how we talk to GitHub behind the scenes. Sign-ins and data syncing are now smoother and less likely to be interrupted during busy periods.
Pull Requests: Browse commits and view coverage at any point
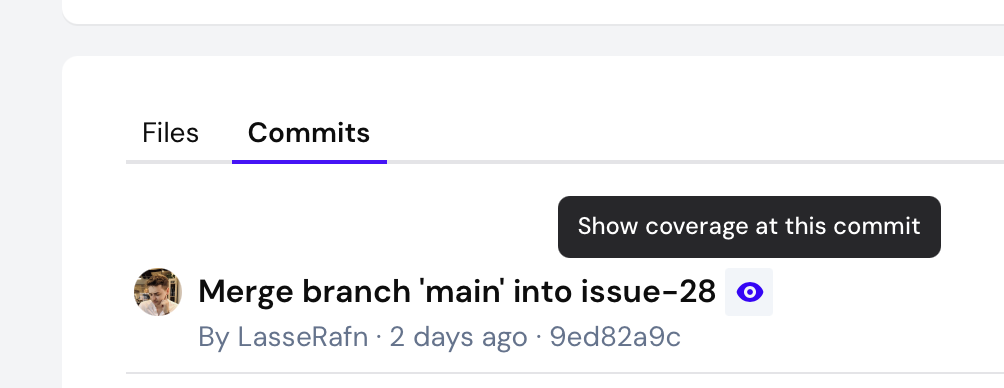
Added a "Commits" tab to the pull request view, listing all commits added to the head branch since the PR was opened, sorted most recent first. Each row shows author, short SHA, message, tracked/covered lines, coverage and patch coverage.
Added a "Show coverage at this commit" button next to each commit in the new tab. Selecting it loads the file tree, coverage stats and file viewer for that commit instead of the PR head, making it easier to compare how coverage evolved across review iterations. A dismissible banner makes the active commit clear and a single click resets back to the PR head.
Fixed: Coverage uploads could fail for repositories with very high execution hit counts (such as lines inside large loops). The internal counters have been widened to handle these cases.
Pull Requests: More Information and cleaner experience
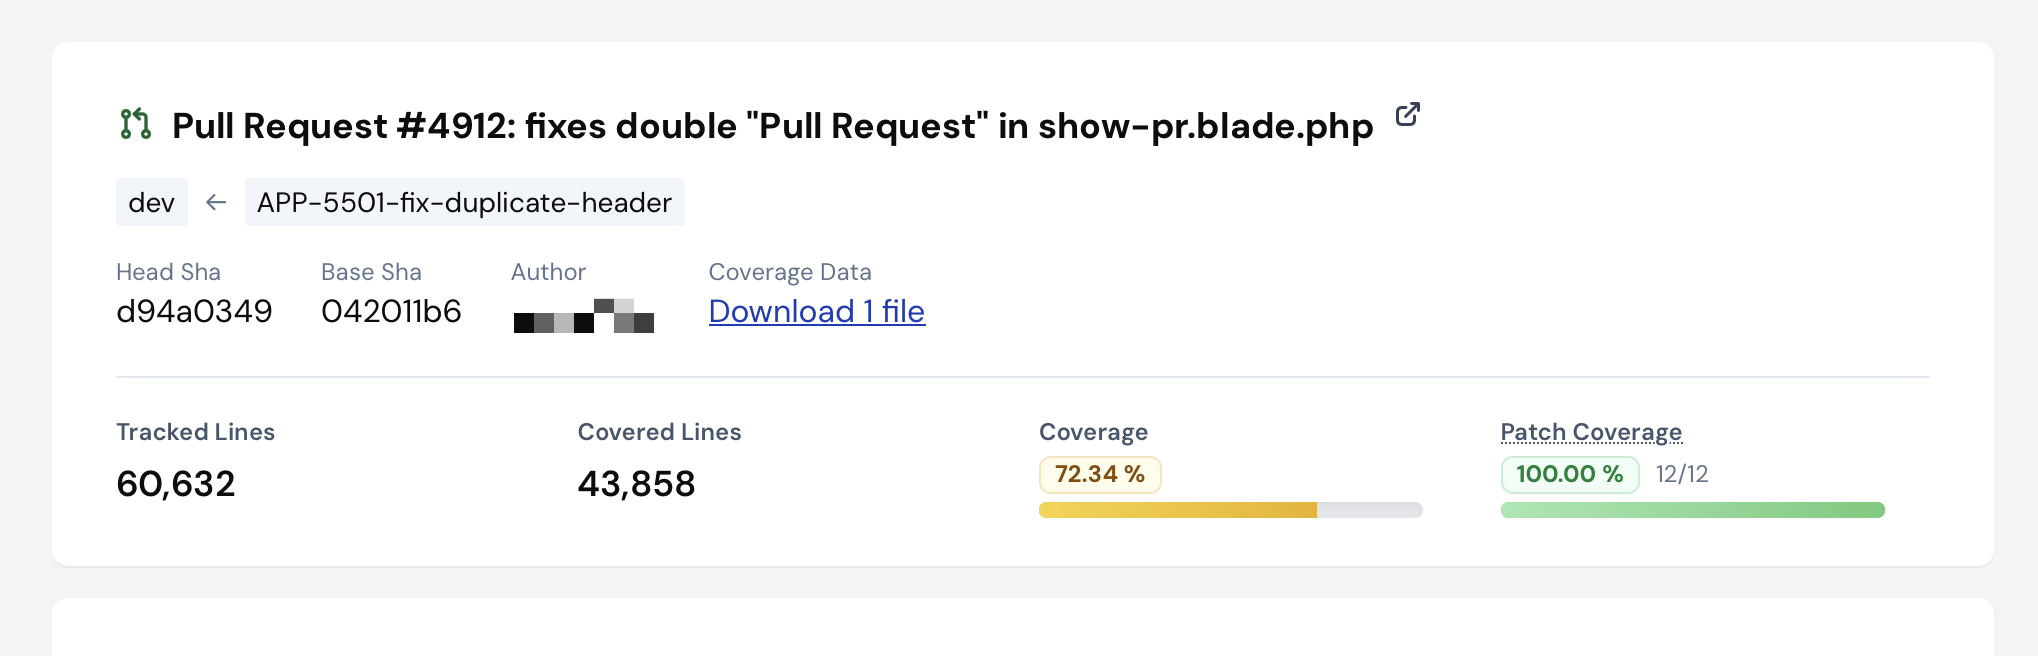
Added more information to the pull request view. This should hopefully make "View full report" more viable for usage during review time. Now includes tracked and covered lines, clearer coverage data, patch coverage, type coverage (when enabled), and deltas where relevant. You can now also see head and base branch as well as PR state (open, closed, ...).
Tightened spacing, cleaned up visuals for a better experience with large pull requests.
Fixed: "Pull Request" was repeated in the header.
Code Viewer: Added quick navigation
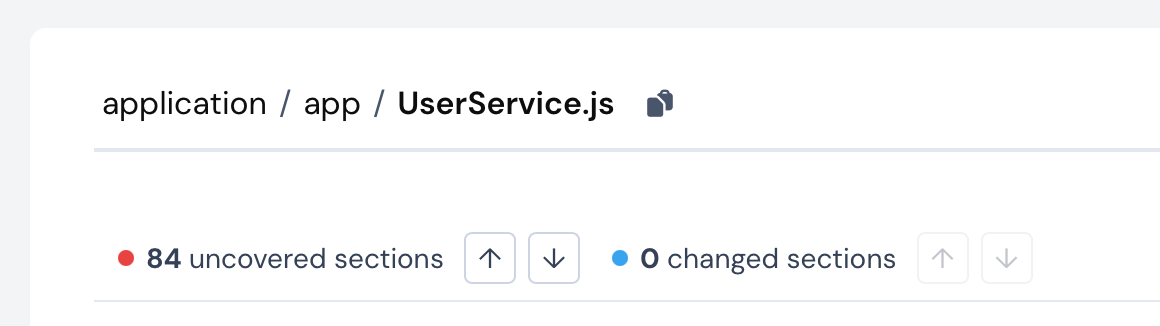
Added quick navigation arrows for uncovered lines of code, called "Sections". A section is when a group of lines are all not covered by tests, without any covered lines in-between them.
Added quick navigation arrows for changed lines when viewing files inside Pull Requests, to quickly hop between changed lines of code.
Fixed: In very rare instances, the file viewer for pull requests would not render diffs for private repositories.
Code Viewer: Added Coverage Minimap
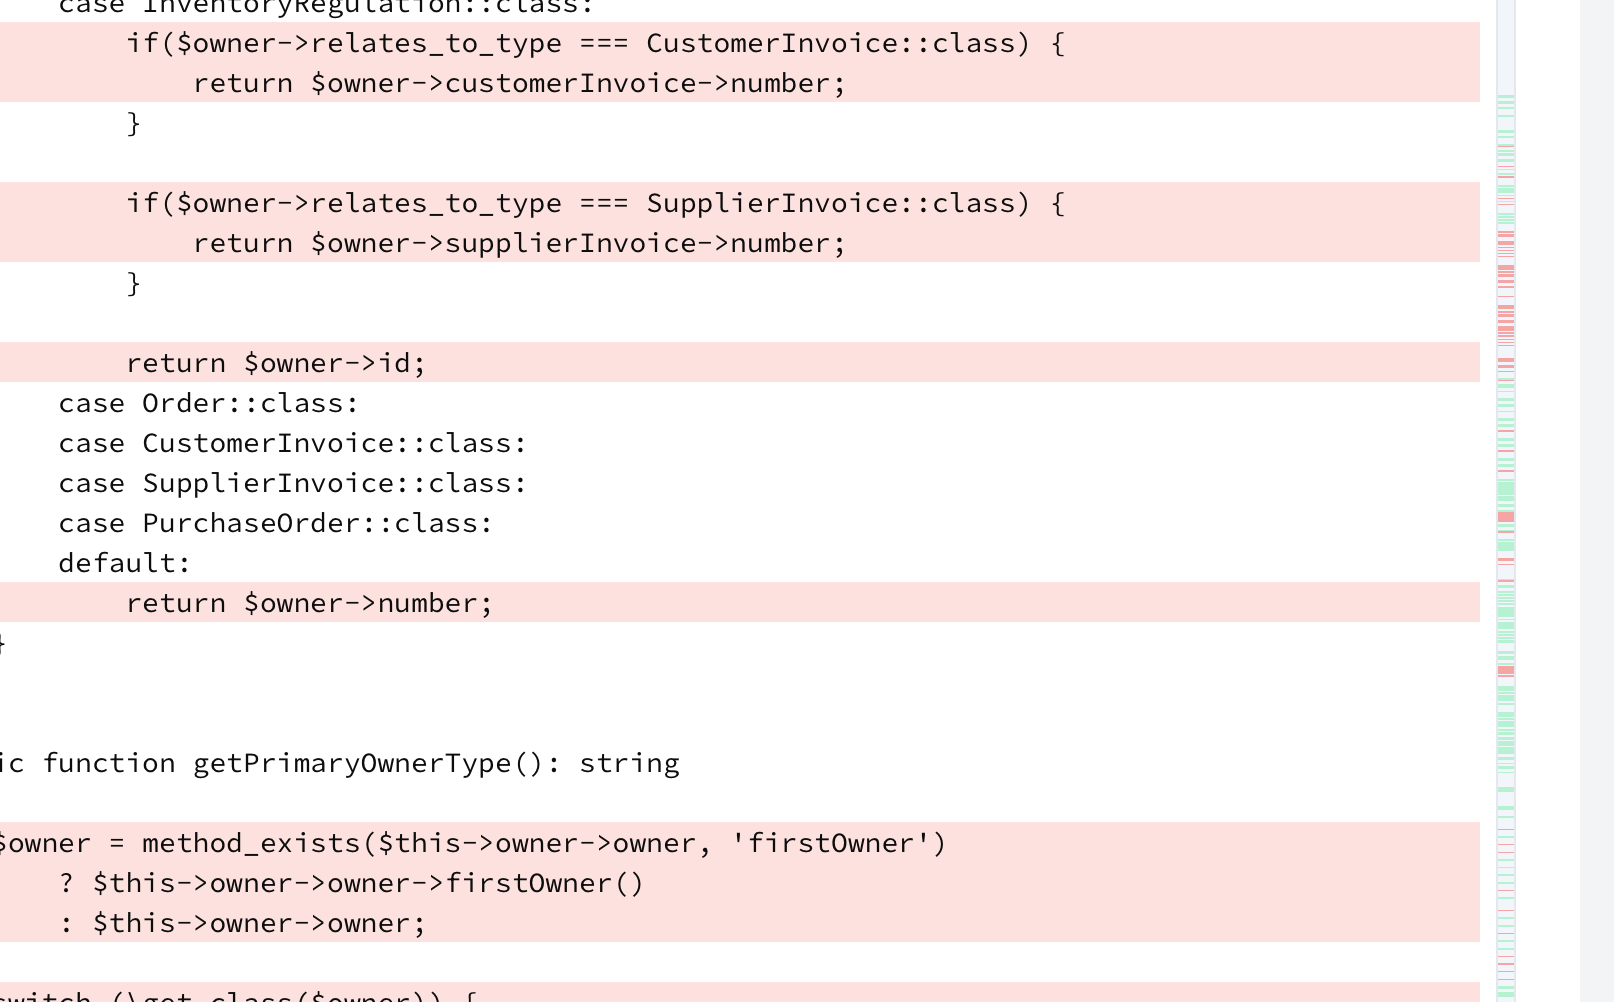
A minimap has been added to the right-side of the in-app code viewer, which gives a quick overview of where coverage gaps are. This is especially useful for large files. You can click on the minimap to navigate to the sections of the code
The alert shown in code viewer ("Using Code Viewer token") informing about expiration is now dismissible to clear up more vertical space.
We are also experimenting with syntax highlighting and displaying of hits, as well as other metrics. It is being gradually rolled out to users over the next 2 weeks with full GA expected on 25th of May 2026.
Code Viewer: Better error when org blocks OAuth app
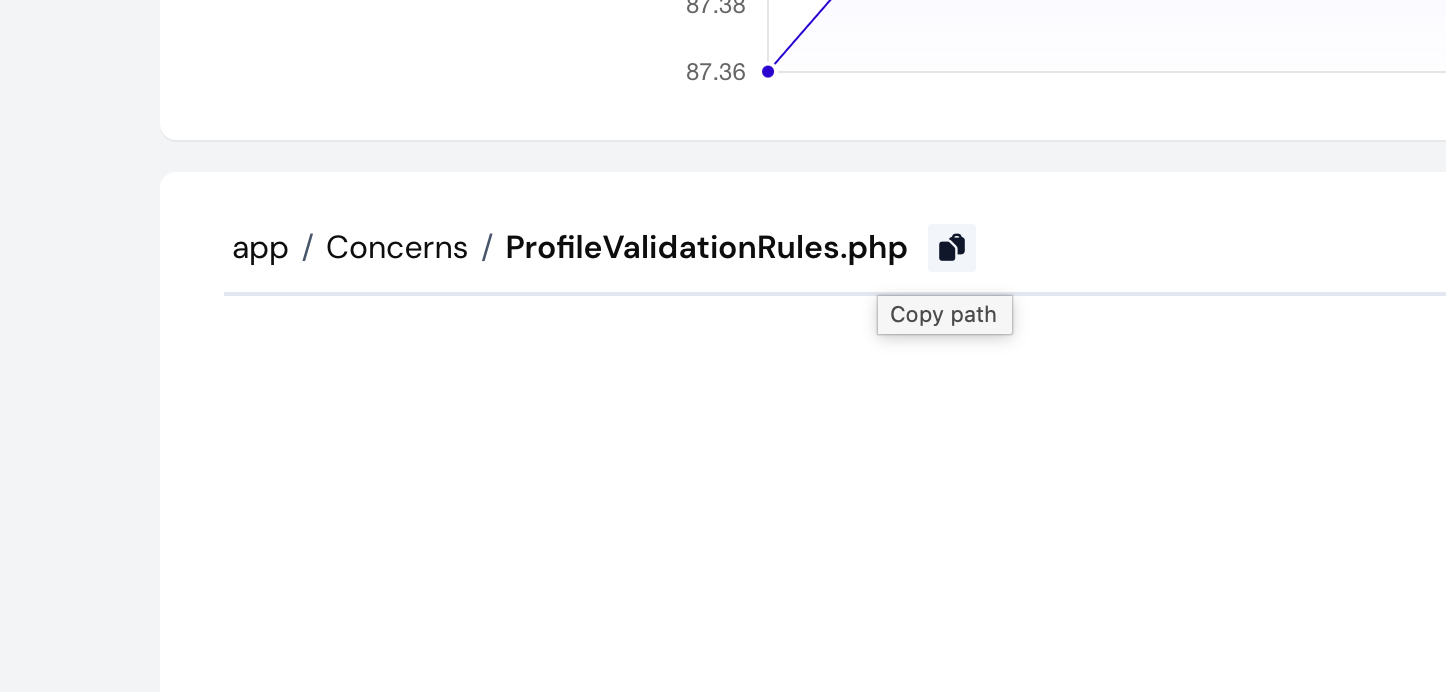
Added a copy button next to the file/folder breadcrumb in the repository file view. It copies the path (without the repository name) to your clipboard, making it easier to share or paste paths elsewhere.
Fixed: Opening a file in the code viewer would error out when the GitHub organization had OAuth App access restrictions enabled but had not approved our code viewer app. The file view now shows a dedicated message naming the organization, with a link to request access on GitHub and a re-authorize button for after an org owner approves.
PR Comment: Flag & Component Coverage Breakdown

Pull Request comments now include a per-flag and per-component coverage breakdown table when multiple flags or components are present (or a single non-default one). Each table shows base coverage, head coverage, and the difference, giving you a clear view of how each flag or component is affected by the pull request.
PR Comment: Fixed body exceeding GitHub character limit
Fixed an issue where Pull Request comments could exceed GitHub's 65,536 character limit for repositories with a large number of files with reduced coverage. The "Files with reduced coverage" table is now limited to the 25 files with the largest coverage drop, with a note when additional files are truncated. A safety truncation has also been added as a safeguard for edge cases.
UI being overhauled in stages
We are slowly rolling out a new version of our dashboard UI. In first iteration, only small changes are being implemented:
- Wider navigation bar
- Small color-coding for dashboard repository list
- Made dashboard less text-heavy
- Dashboard is now more condensed, showing up to 2x more repositories above the fold
- Dashboard now shows repositories with coverage above those without
- Removed progress bar in dashboard, in favour of a faint background color which acts as a progress bar
In the upcoming releases, we have the following (and more) planned:
- Dark Mode
- Better dashboard for organizations with fewer repositories
- Faster file-list rendering
- Complete overhaul of illustrations, charts, ...
- More search, filter and sort options
- Visual and experience improvements to all pages
We appreciate any feedback on the current and upcoming design changes. The goal is to improve your experience. All opinions and ideas are welcome!
Removed "All orgs and repos" menu for users without multiple organizations
Auto selected first organization for users without multiple organizations
Leaderboard: Fixed "New Covered Lines" metric
Fixed the "New Covered Lines" leaderboard category reporting inflated numbers. The metric was incorrectly using execution hit counts (how many times a line was executed) instead of distinct covered lines. For example, a single line inside a loop executed 1,000 times would count as 1,000 rather than 1. The leaderboard now correctly counts the number of unique newly covered lines per pull request.
Cycle Time Percentiles in Reporting
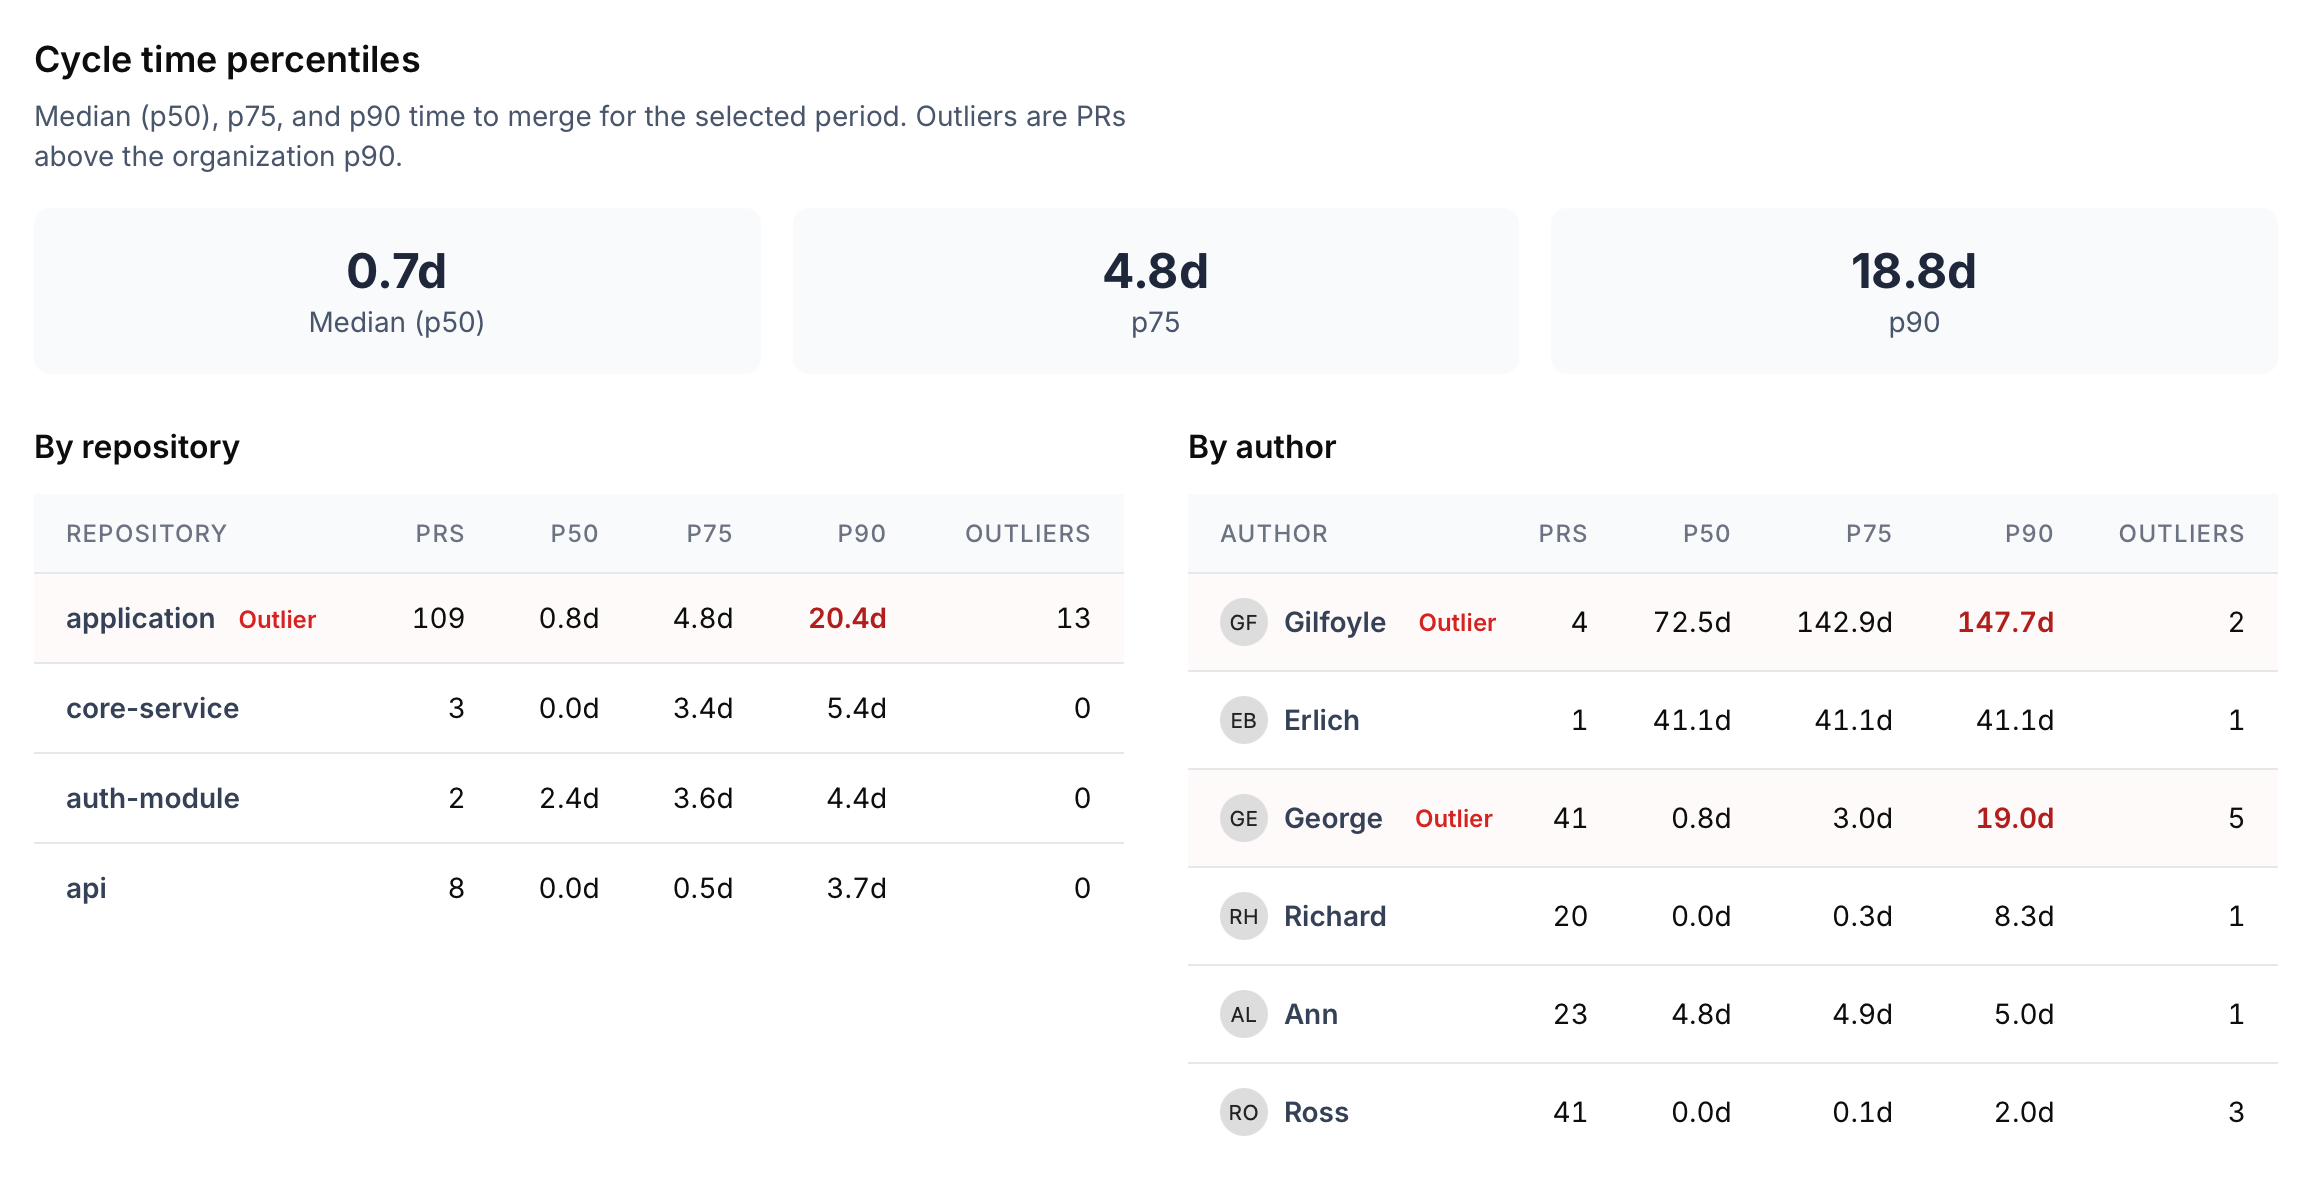
Organization Reporting → Pull Requests now includes Cycle Time Percentiles (p50, p75, p90) with repo and author breakdowns. This helps you spot slow review paths and outliers at a glance.
Complexity vs Coverage Quadrant in Analytics
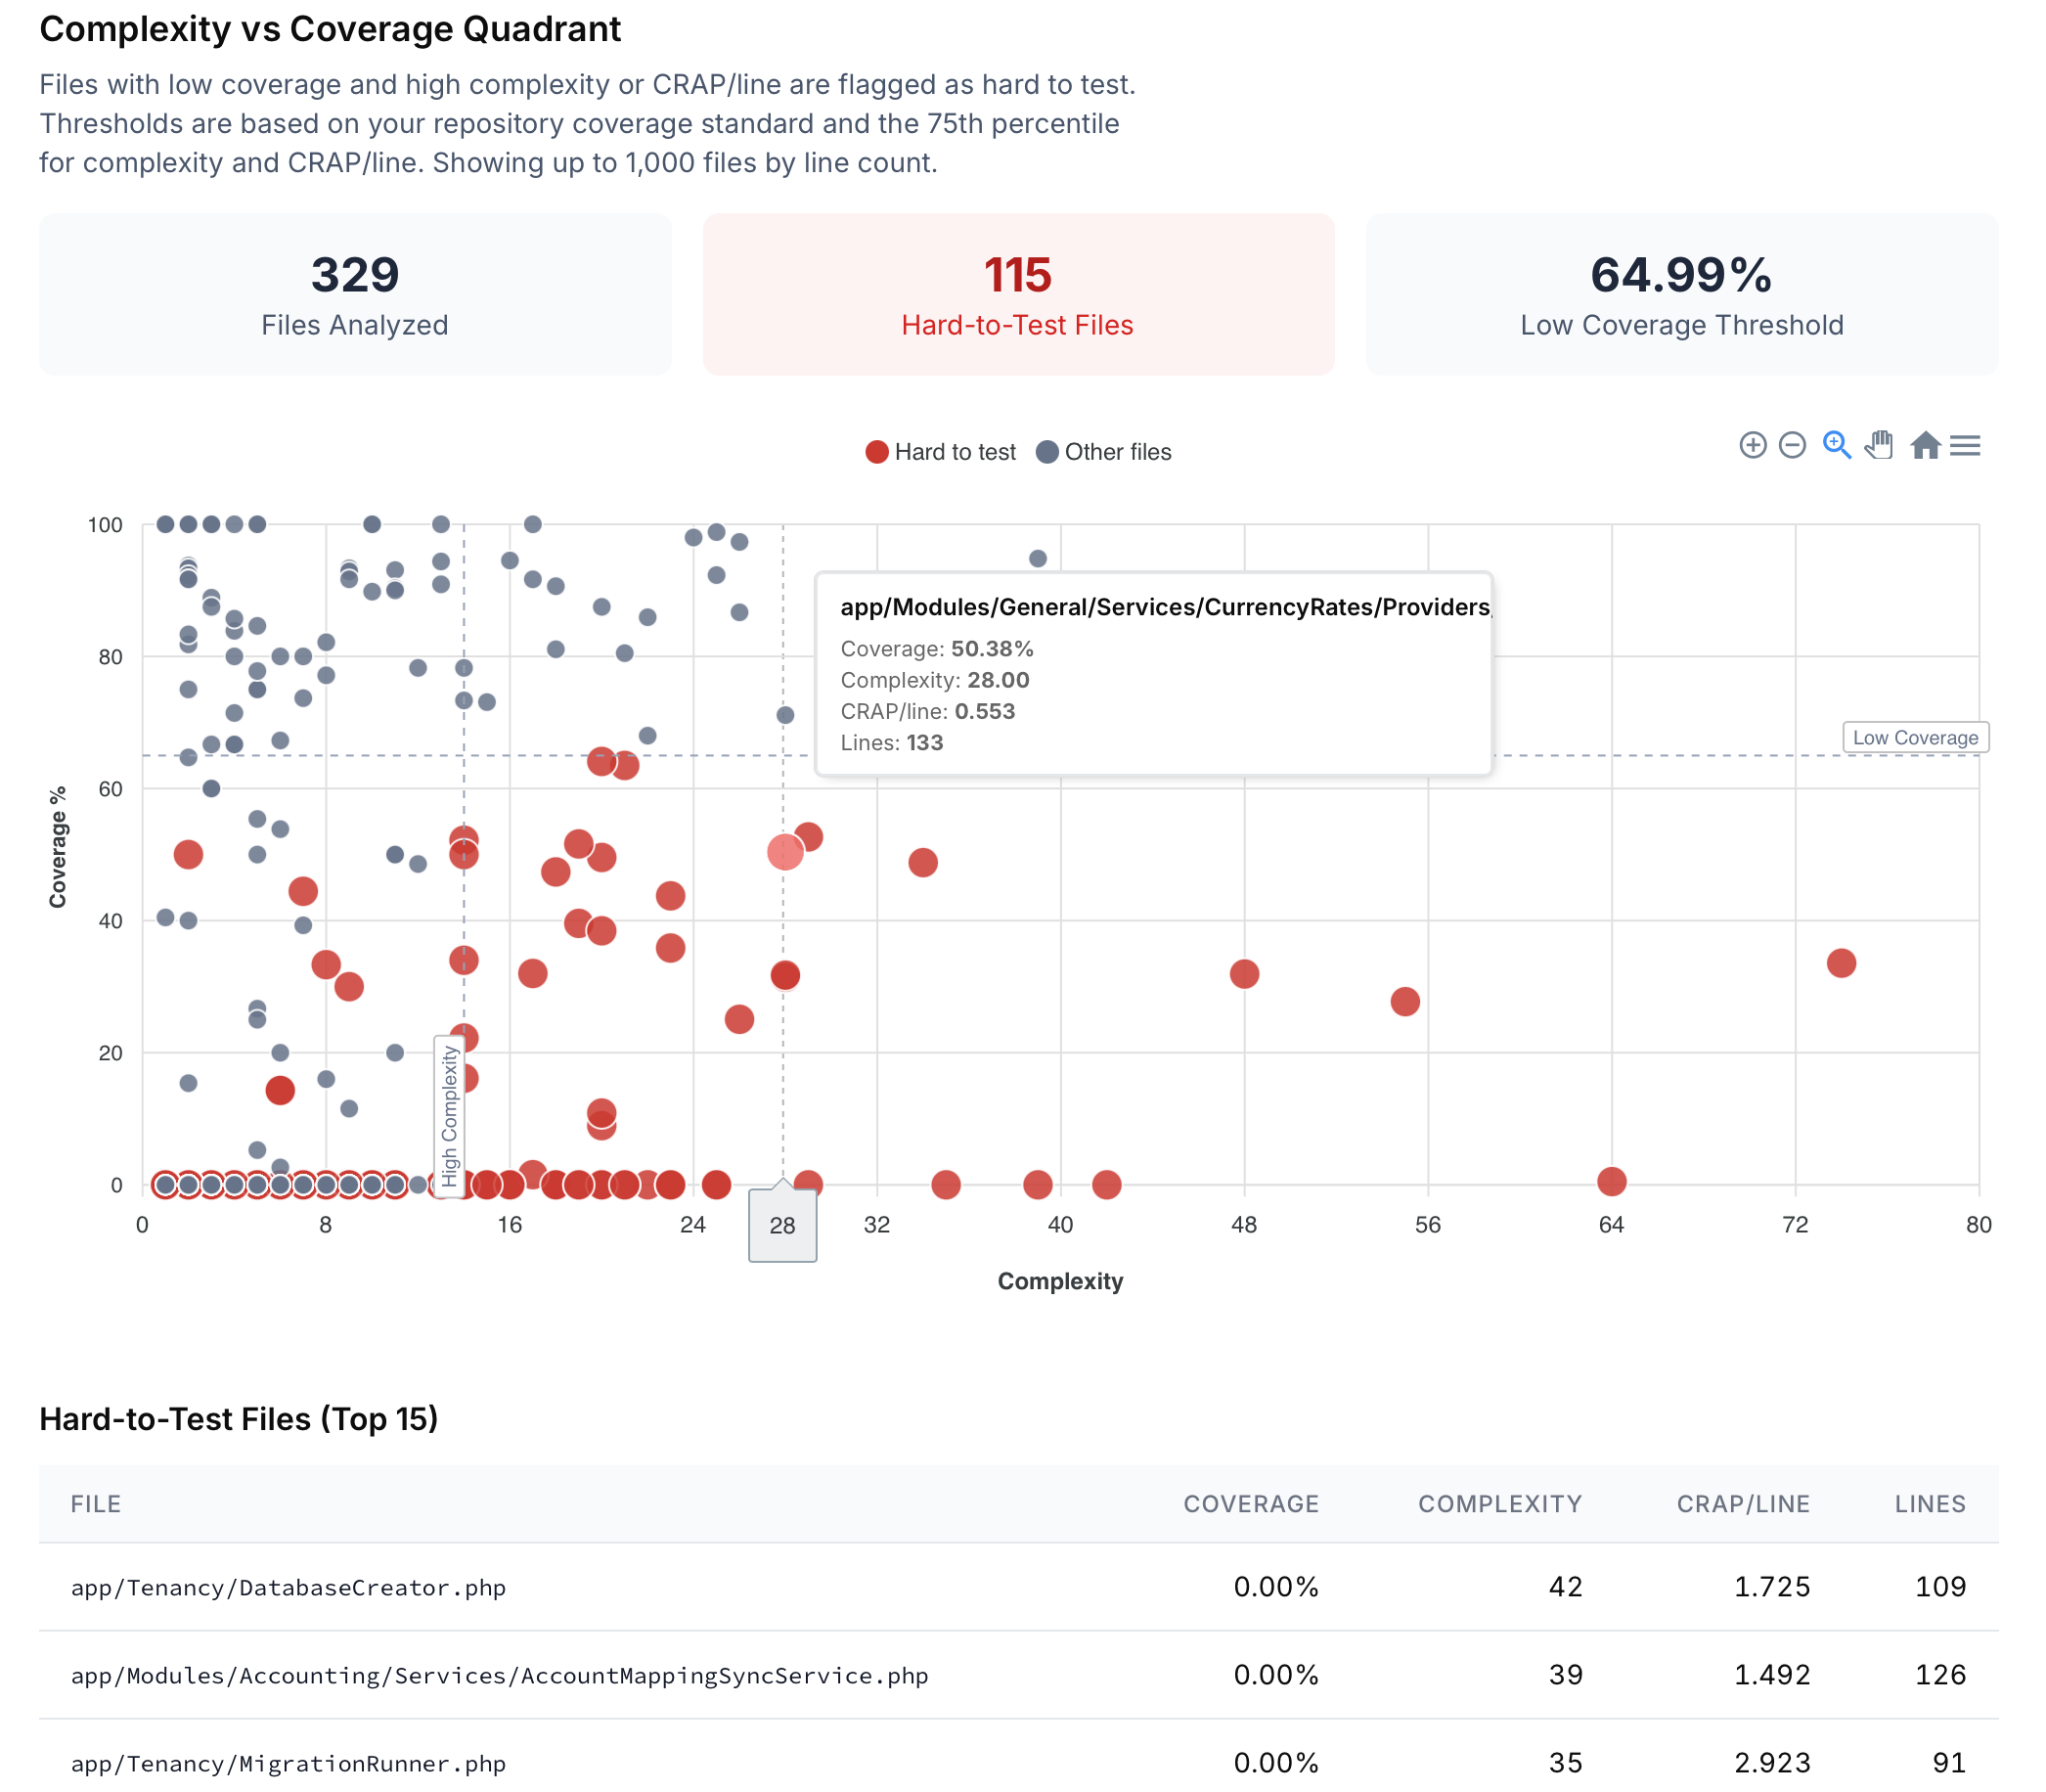
Repository Analytics now includes a Complexity vs Coverage quadrant chart that highlights “hard to test” files (low coverage + high complexity/CRAP per line). You can click points to jump directly to the file, and use the table to prioritize the top candidates for testing improvements.
Time-to-merge chart added to Reporting
Organization Reporting → Pull Requests now includes a new "Time to merge" chart. It shows the average number of days from PR creation to merge, grouped by month, so you can spot review-cycle trends over time.
Churn-Weighed Coverage Risk Report Rolling Out
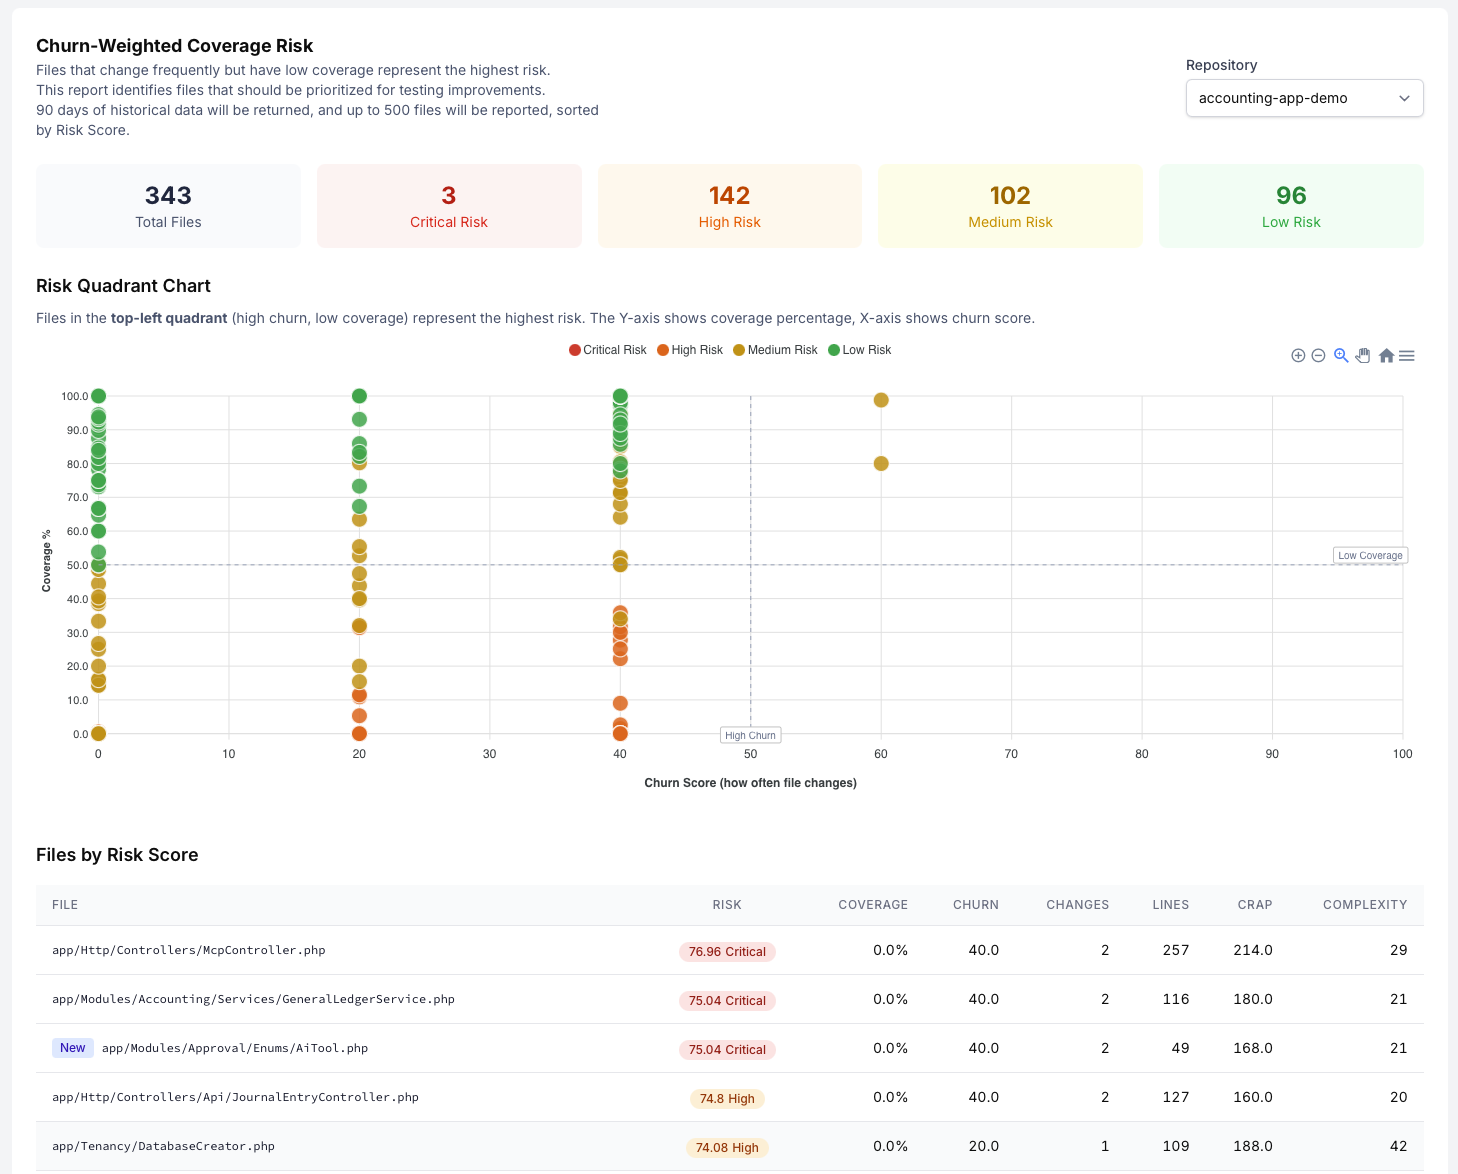
A new report is being rolled out: Churn-Weighed Coverage Risk.
This new report will highlight your most frequently changing files along with their coverage, and complexity metrics if your coverage format supports it.
Frequently changing files with high complexity and low coverage are high risk to introduce bugs or other side effects, and great candidates for adding tests.
We will do a slow rollout to gather feedback, fix bugs and improve performance, aiming for general availability in mid-february.
More information will be added in our upcoming blog posts which will dive deeper.
Code Viewer Expiration Can Now Be Changed
We recognise that the 2-hour expiration window for code viewer tokens was not ideal for all use cases.
So starting today, users can now opt to change this to any of the following: 2 hours, 8 hours, 24 hours, 3 days, 7 days, 14 days, 30 days.
This should give much greater flexibility to teams that frequently use the code viewer.
You can modify your token expiration in your profile page (link also provided when authorizing the code viewer).
A note on security: the code viewer is completely safe to use. Revocation, expiration and auth-separation is built because we believe in "minimum permission by default". We have seen competitors get hacked and source code potentially exposed, so this feels like a necessary step to limit risk.
Contributor Reports now available
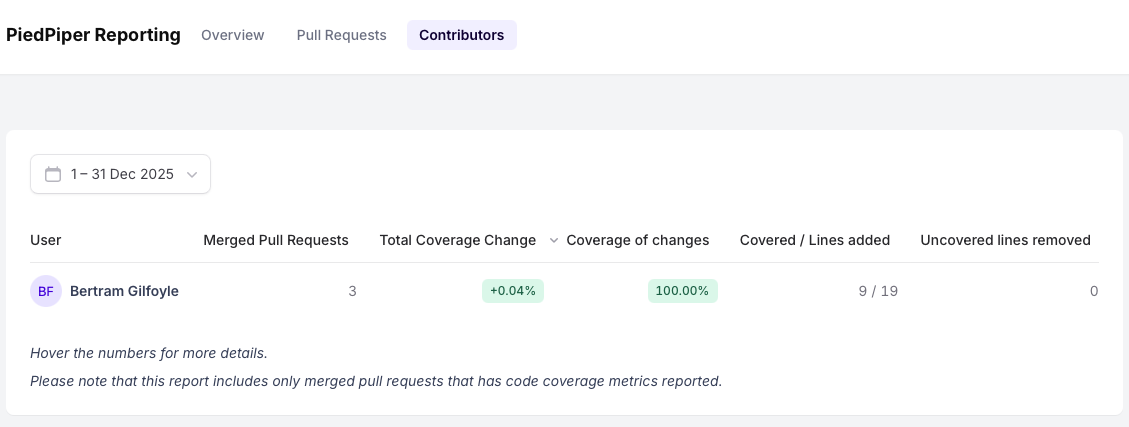
The Contributors tab in Organization Reporting is shows per-contributor coverage metrics from merged pull requests, including: number of merged PRs, total coverage change, average patch coverage, lines added with coverage, and uncovered lines removed. Organization admins can optionally enable access for all members using the "Public User Reporting" setting.
Ship better code faster, with confidence.
PR comments, status checks, line annotations, and trends, all without code access. Free for public repos; per-repo pricing for private repos.
