Changelog
A peek into what's been going on in the OtterWise product development department. We publish changelogs for even the smaller updates, in an effort to stay transparent.
Status Checks for Patch Coverage is now always included
To avoid situations where GitHub Branch Protection rules for Patch coverage got stuck in pending, we now push status checks for Patch Coverage regardless of patch lines being present or not, this means you will see 100% patch coverage in those situations.
API: Repository Search Functionality Added
Implemented API search functionality for the repository list using
?query=[search query], allowing for searching repositories by name wildcard.
Bash Uploader: CI Compatibility & Reliability Update
New CI Platform Support
- GitLab CI - Full integration with pipeline tracking, merge request handling, and automatic branch detection.
- Azure Pipelines - Complete support including build tracking, PR detection, and automatic branch name normalization.
SHA-256 Support - Now accepts both SHA-1 (40 char) and SHA-256 (64 char) commit hashes for Git's new hash algorithm.
Improved support for TravisCI, CircleCI, AppVeyor, Jenkins, GitHub Actions with more relevant data and better detection.
GitHub Action Workflow - Now supports pinning the bash-uploader to a specific commit SHA using input
bash-uploader-sha: [SHA]
Cross-Platform Compatibility - Fixed sed command failures on macOS/BSD systems by removing GNU-specific flags.
First commit detection using
git showinstead of failingBetter detached HEAD state handling with multiple fallback strategies
Added pre-flight checks for required tools (git, jq, curl, awk) with clear error messages.
Added
claudeto ignored bots, to avoid giving credit to bots/LLMs for coverage changes.
Added Complexity Per-file in repository view
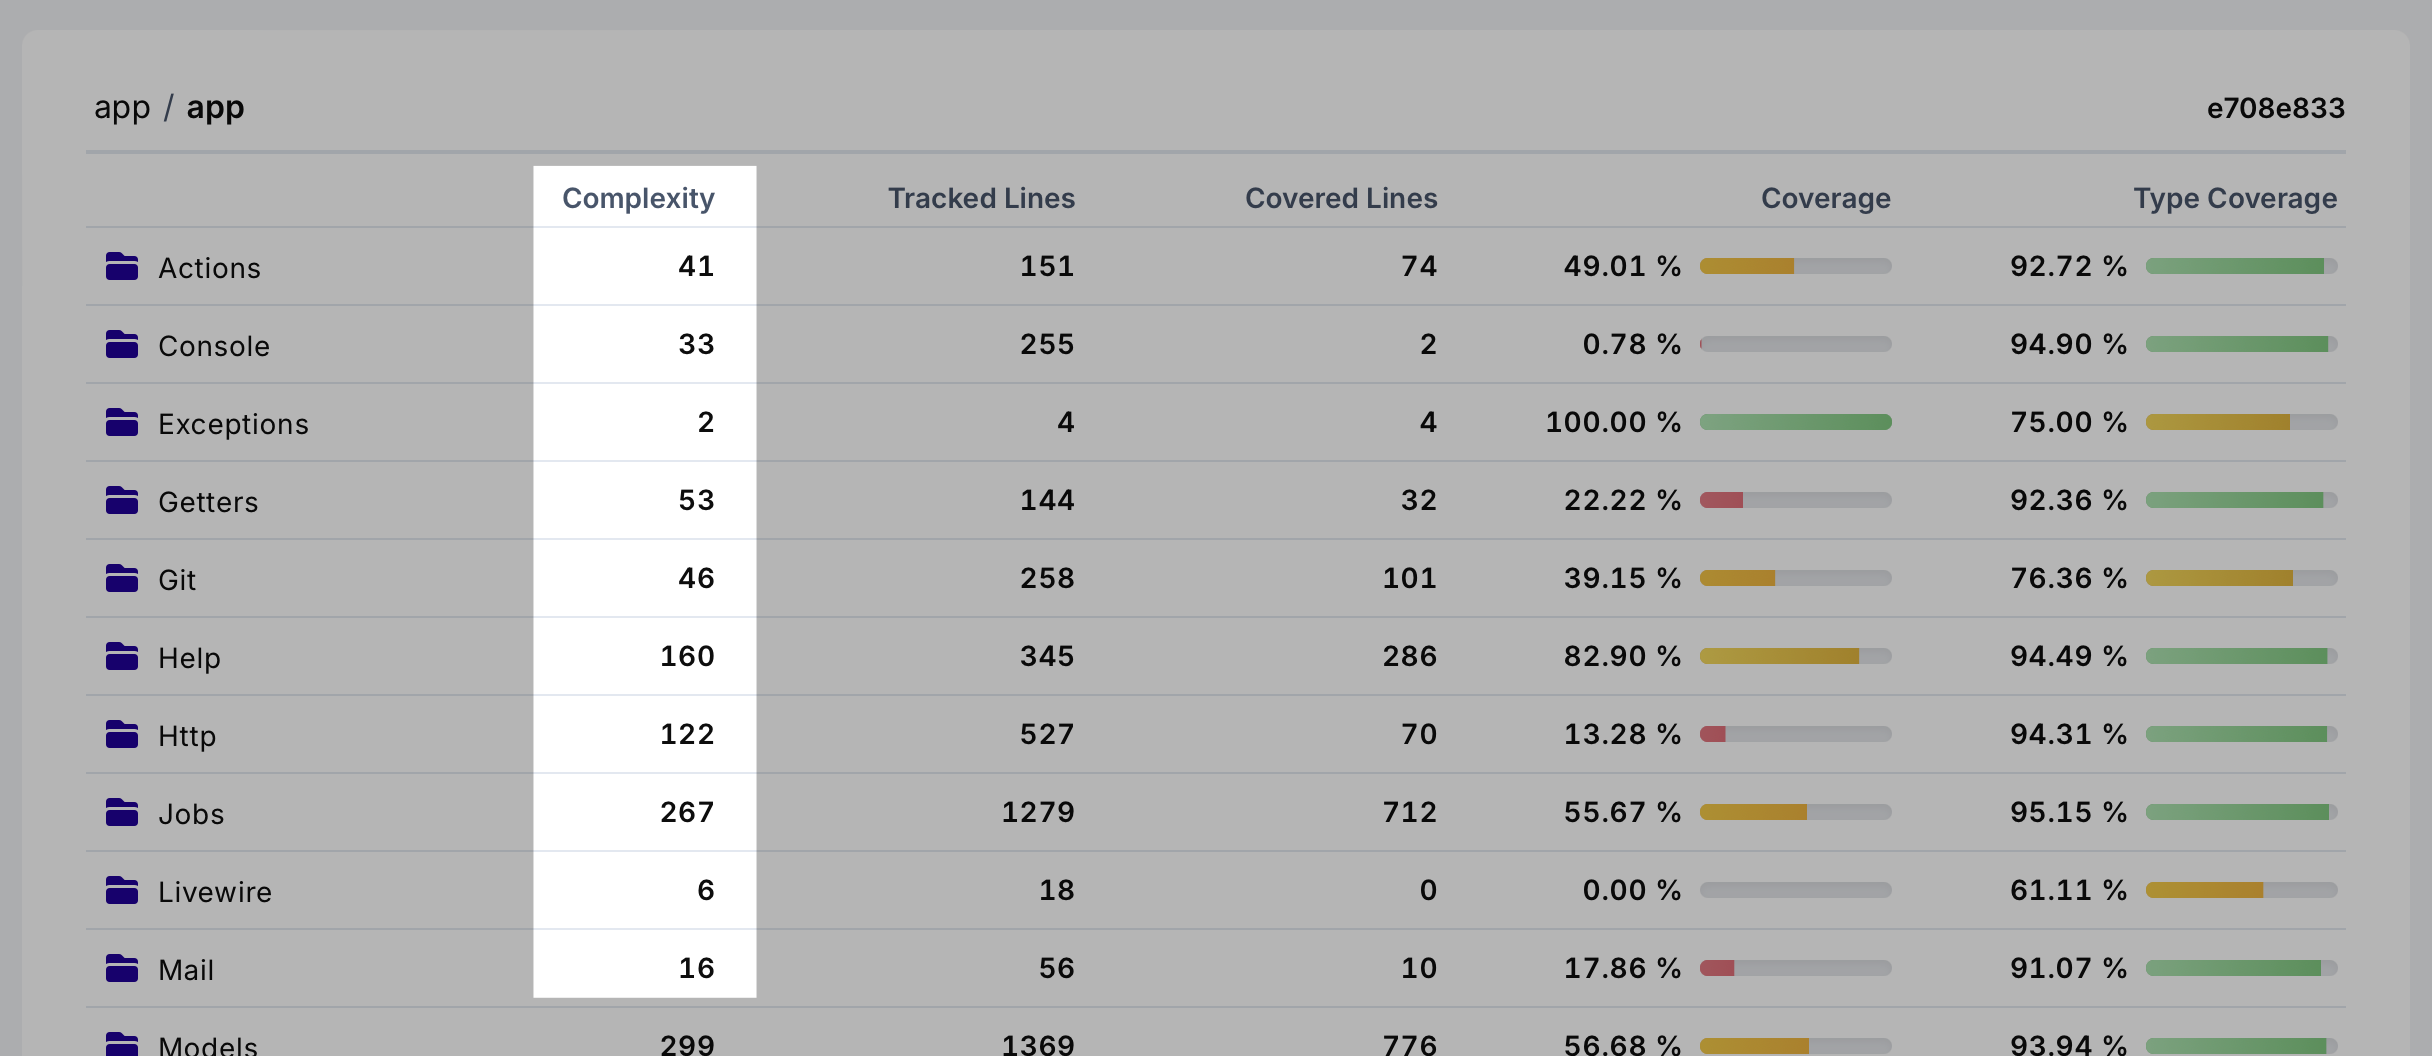
You can now see Complexity per file when viewing the repository file list. This is a great way to identify complex files that might need refactoring or simplification to improve code quality.
Soon we will be adding sorting and new graphs to better visualize complexity per file and over time.
Added GoLang-coverage file support
We have added support for parsing code coverage files outputted by Go using the command:
go test -coverprofile=coverage.out.The most recent version of the bash uploader will also automatically look for
coverage.outfile in the root unless a specific filename is set.This means you can upload coverage files from the standard Go testing library without installing gocover-cobertura or similar tools anymore.
See our Blog post on Go and our Go documentation page.
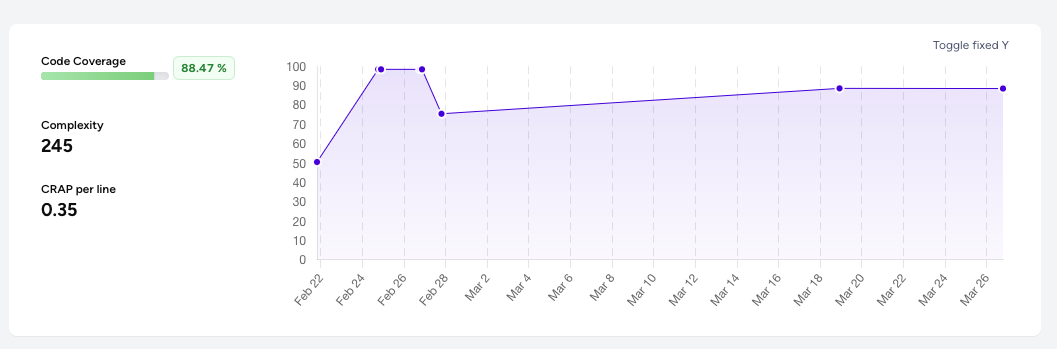
Introducing Graphs for CRAP per line and Complexity in the repository view
Today we are adding graphs for CRAP per line and Complexity when viewing the repository, for all plans. Simply click the metrics when available and it will show you a history of coverage, complexity or 'CRAP per line' respectively.
Each metric shows the difference introduced, such as increased coverage, decreased complexity and so on.
As with coverage, the complexity and 'CRAP per line' also links to the related commit / Pull Request and will take you there simply by clicking on the point in the graph when hovered.
This will give your team a much better understanding of what is going on with your projects code quality.
We are also working on adding historical type coverage reporting into this graph, as well as other reporting features being added to all plans.
Fixed: Ingress pipelines has been improved to better handle spikes and invalid data
Fixed: Chrome browser extension now works with latest GitHub UI changes
We now have an official GitHub Actions uploader, which can be found at GitHub Marketplace
Improved: The Bash Uploader now has automatic fallback to our old upload endpoint for increased reliability.
Today we had significant downtime (57 minutes) for the first time in years, something we consider unacceptable. To prevent this from happening again, we have made several changes to our infrastructure and processes:
Instead of a simple load-balanced setup for our Ingress API, we have moved to a queue-based system handled by Cloudflare Workers, with fallback to AWS Lambda, and with final failover back to the original endpoint. This makes the system more resilient to spikes in traffic and failures in individual components.
This means that the Ingress API is no longer a single point of failure, and can handle much higher loads.
You should also see improved latency when uploading coverage data, due to the edge-based nature of Cloudflare Workers.
This process requires no changes on your end, and your existing upload scripts will continue to work as before. We will continue to monitor this new setup closely.
We have also added a link to our Uptime Statuspage in the footer of our website, so you can always check the current status of our services.
In short, this means our database, website, API, dashboard and other components can crash or be taken down for maintenance, without affecting your ability to upload coverage data.
Fixed: Line annotations would sometimes fail to be created when Git diffs with deletions were processed, this was due to non-sequential line numbers in the diff. This has been fixed and line annotations should now be created correctly going forward as well as historically.
Fixed: API Token creation was mistakenly hidden behind a feature flag for ~50% of users, which meant that some users could not create API Tokens. This has been fixed and all users can now create API Tokens. This was reported by users using our Browser Extensions, which requires API Tokens to work.
Fixed: API Token creation was mistakenly hidden behind a feature flag for ~50% of users, which meant that some users could not create API Tokens. This has been fixed and all users can now create API Tokens. This was reported by users using our Browser Extensions, which requires API Tokens to work.
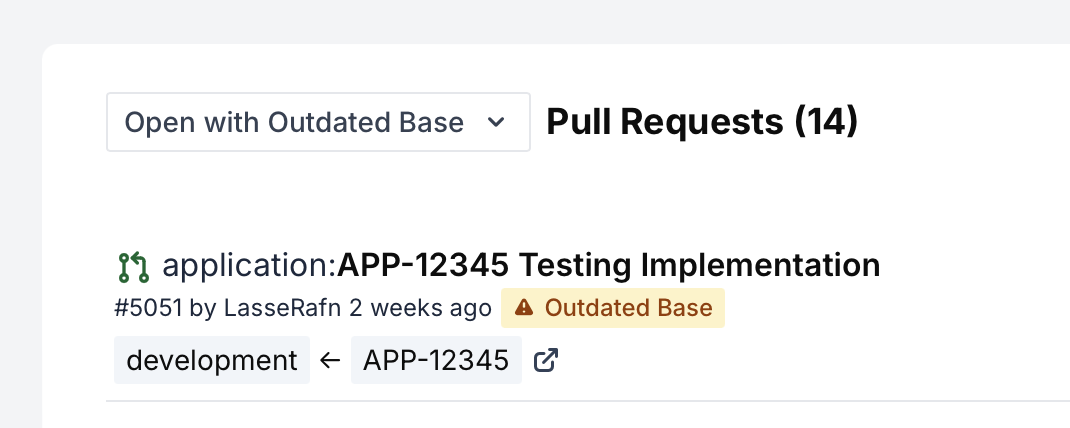
Pull Requests: Added "Outdated Base" badge on Pull Requests where the base branch has had more recent coverage uploaded in the Pull Requests overview inside OtterWise. This is to help identify Pull Requests that might need a rebase or merge to get the latest coverage data from the base branch.
Pull Requests: Added new filter option "Open with Outdated Base" to the Pull Requests overview inside OtterWise, to quickly find Pull Requests that have an outdated base branch.
Coverage graph now goes to latest commit date rather than today, filling out the graph better for repositories with infrequent commits.
Fixed: The sparklines introduced in a recent release now shows coverage data only for the default branch, rather than all commits for the repository. This was causing confusion as the sparklines would show data for branches that were not the default branch, and could be misleading.
Removal of Test Performance: We made the decision to remove the test performance feature due to low usage. All repositories with test performance data will continue to have access to it, but it will not be possible to enable going forward. We will focus on adding and improving other features that are more widely used.
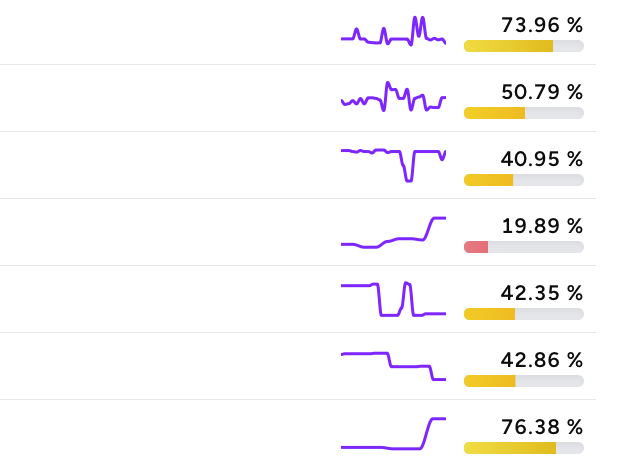
The dashboard now features sparklines for enabled repositories with data, showing latest 28 commits with coverage data. This is a great way to quickly see how your coverage is trending over time. Its not fixed to a 0-100 y axis, and will therefor display even small changes in coverage very clearly. Hovering it will display time and coverage %.
Read more about the commit view from patch 2025-02-18
GitHub status checks now link to the new commit view if not associated to a pull request (eg when pushing directly to main branch, or before making a PR).
Coverage graph points for commits without a pull request associated can now also be clicked, leading to the new commit view.
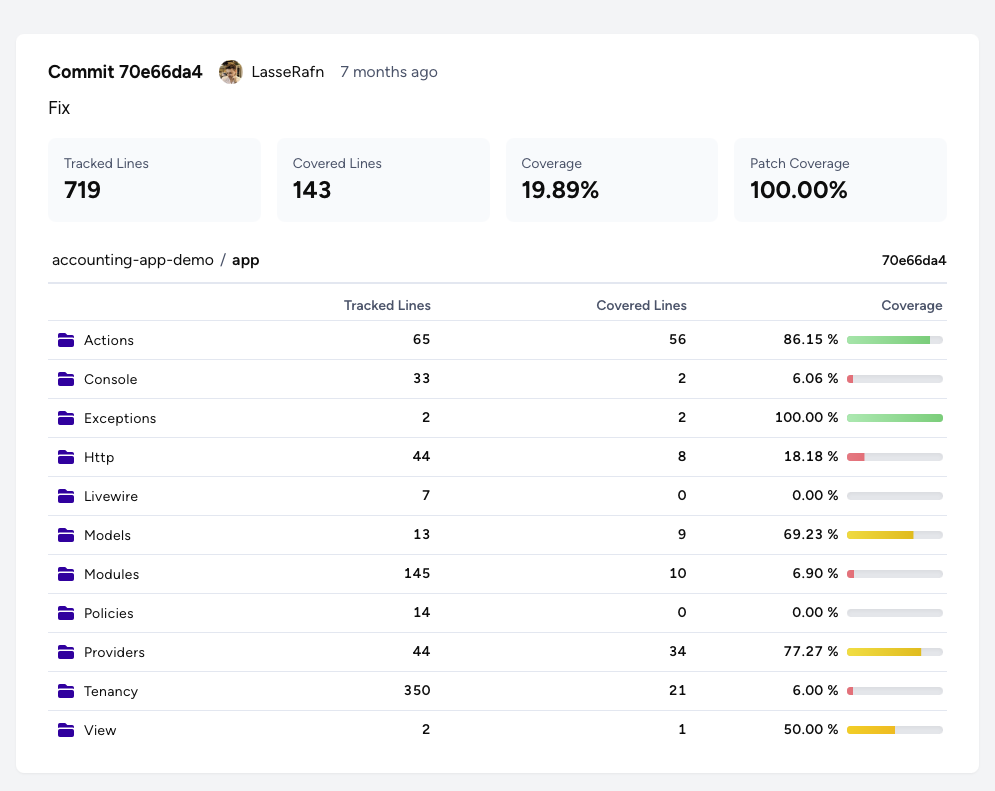
Viewing specific commits and their coverage data is now generally available. You find it under the repository -> commits and clicking the commit message.
Added LCOV coverage format support for code coverage. This is a popular format for JavaScript and other languages, and can be used in combination with Jest, Karma, Istanbul and more.
Ship better code faster, with confidence.
PR comments, status checks, line annotations, and trends, all without code access. Free for public repos; per-repo pricing for private repos.
