Go Code Coverage Tracking: Best Practices and CI/CD Integration
Master code coverage in Go with native tooling, automated tracking, and CI/CD integration for better code quality.
Tracking code coverage in Go is essential for maintaining code quality and ensuring your tests actually test your code. Here's everything you need to know:
- Use Go's built-in coverage tools (
go test -coverprofile) - Understand coverage modes (set, count, atomic)
- Automate coverage tracking in CI/CD
- Monitor coverage trends over time
- Set meaningful coverage goals
Quick start:
# Generate coverage report
go test -coverprofile=coverage.out ./...

# View in terminal
go tool cover -func=coverage.out

# View as HTML
go tool cover -html=coverage.out
Why track coverage?
- Identify untested code paths
- Catch regressions early
- Build confidence in refactoring
- Maintain code quality standards
Unlike some languages that require third-party tools, Go has native coverage support built right in. This makes tracking coverage straightforward and consistent across projects.
| Benefit | Impact |
|---|---|
| Native tooling | No external dependencies |
| Fast execution | ~3% overhead |
| Multiple formats | Text, HTML, profiles |
| CI/CD ready | Easy automation |
| Integration support | Works with coverage platforms |
Ready to level up your Go testing? Let's dive into best practices and automation.
Understanding Go's Coverage System
Go takes a unique approach to code coverage that sets it apart from other languages.
How Go Coverage Works

Instead of instrumenting compiled binaries like traditional coverage tools, Go rewrites your source code before compilation. Here's what happens:
- Source Rewriting: Go modifies your code to add coverage counters
- Compilation: The modified source gets compiled normally
- Execution: Tests run and counters record what executed
- Reporting: Statistics get dumped to a coverage profile
As the Go blog explains:
"Rewrite the package's source code before compilation to add instrumentation, compile and run the modified source, and dump the statistics."
This approach has huge benefits:
- Low overhead: Only ~3% runtime cost
- Portable: Works across all architectures
- Flexible: Enables different output formats
- Accurate: Source-level precision
The Three Coverage Modes
Go offers three coverage modes via the -covermode flag:
1. Set Mode (Default)
go test -covermode=set -coverprofile=coverage.out ./...
Tracks whether each statement executed (0 or 1). Fast and sufficient for most use cases.
2. Count Mode
go test -covermode=count -coverprofile=coverage.out ./...
Measures how many times each statement executed. Useful for identifying hot paths and frequently tested code.
3. Atomic Mode
go test -covermode=atomic -coverprofile=coverage.out ./...
Like count mode but thread-safe. Use this when running parallel tests to ensure accurate counts.
Pro tip: Use
atomicmode in CI/CD pipelines where tests run in parallel. The slight performance overhead is worth the accuracy.
Basic Coverage Commands
Let's walk through the essential coverage commands every Go developer should know.
Generate a Coverage Report
The foundation of coverage tracking:
# All packages
go test -coverprofile=coverage.out ./...

# Specific package
go test -coverprofile=coverage.out ./pkg/mypackage

# With race detection
go test -race -coverprofile=coverage.out ./...
View Coverage in Terminal
Quick coverage summary:
# Function-level coverage
go tool cover -func=coverage.out

# Output example:
# github.com/user/project/calculator.go:10:  Add         100.0%
# github.com/user/project/calculator.go:15:  Subtract    75.0%
# github.com/user/project/calculator.go:20:  Multiply    0.0%
# total:                                     (statements) 75.0%
Generate HTML Coverage Report
See exactly which lines are covered:
go tool cover -html=coverage.out -o coverage.html
This opens an interactive HTML page showing:
- Green highlighting: Covered code
- Red highlighting: Uncovered code
- Gray: Non-executable code (comments, declarations)
Coverage for Specific Tests
Run coverage for a single test or group:
# Single test
go test -coverprofile=coverage.out -run TestAdd

# Test group (regex)
go test -coverprofile=coverage.out -run TestCalculator.*
Monitor your test quality
With OtterWise, you can track Code Coverage, contributor stats, code quality, and much more.
Free for open source
Setting Up Coverage in GitHub Actions
Automate coverage tracking in your CI/CD pipeline to catch coverage drops before they hit production. For a complete guide, see our GitHub Actions documentation.
Basic GitHub Actions Workflow
Create .github/workflows/coverage.yml:
name: Test Coverage

on:
  push:
    branches: [ main, develop ]
  pull_request:
    branches: [ main ]

jobs:
  coverage:
    runs-on: ubuntu-latest

    steps:
    - uses: actions/checkout@v6
      with:
        fetch-depth: 2  # Needed for PR diffs

    - name: Set up Go
      uses: actions/setup-go@v5
      with:
        go-version: '1.23'
        cache: true

    - name: Install dependencies
      run: go mod download

    - name: Run tests with coverage
      run: go test -v -race -coverprofile=coverage.out -covermode=atomic ./...

    - name: Display coverage
      run: go tool cover -func=coverage.out
This workflow:
- Runs on every push to main/develop
- Triggers on pull requests
- Uses Go 1.23 with caching
- Runs tests with race detection
- Generates and displays coverage
Integrating with OtterWise
OtterWise natively supports Go's coverage format, making integration seamless. No conversion tools needed!
Add coverage tracking to your workflow:
name: Test Coverage

on:
  push:
    branches: [ main, develop ]
  pull_request:
    branches: [ main ]

jobs:
  coverage:
    runs-on: ubuntu-latest

    steps:
    - uses: actions/checkout@v6
      with:
        fetch-depth: 2

    - name: Set up Go
      uses: actions/setup-go@v5
      with:
        go-version: '1.23'
        cache: true

    - name: Install dependencies
      run: go mod download

    - name: Run tests with coverage
      run: go test -v -race -coverprofile=coverage.out -covermode=atomic ./...

    - name: Upload coverage to OtterWise
      uses: getOtterWise/github-action@v1
      with:
        token: ${{ secrets.OTTERWISE_TOKEN }}
What you get:
- Automatic coverage tracking on every commit
- PR comments showing coverage changes
- Historical coverage trends
- Coverage badges for your README
- Failed checks if coverage drops below threshold
Remember to add your
OTTERWISE_TOKENto GitHub Secrets (Settings > Secrets and variables > Actions).
Multi-Version Testing
Test against multiple Go versions:
name: Test Coverage

on: [push, pull_request]

jobs:
  coverage:
    runs-on: ubuntu-latest
    strategy:
      matrix:
        go-version: ['1.21', '1.22', '1.23']

    steps:
    - uses: actions/checkout@v6
      with:
        fetch-depth: 2

    - name: Set up Go ${{ matrix.go-version }}
      uses: actions/setup-go@v5
      with:
        go-version: ${{ matrix.go-version }}
        cache: true

    - name: Install dependencies
      run: go mod download

    - name: Run tests
      run: go test -v -race -coverprofile=coverage.out -covermode=atomic ./...

    - name: Upload coverage
      # Only upload from one Go version to avoid duplicates
      if: matrix.go-version == '1.23'
      uses: getOtterWise/github-action@v1
      with:
        token: ${{ secrets.OTTERWISE_TOKEN }}
Best Practices for Go Code Coverage
1. Aim for Meaningful Coverage, Not Just High Numbers
Don't chase 100% coverage blindly. Focus on testing:
- Business logic and algorithms
- Error handling paths
- Edge cases and boundary conditions
- Public APIs and interfaces
Skip or minimize testing:
- Simple getters/setters
- Generated code
- Third-party code
- Trivial constructors
// Worth testing: Complex business logic
func CalculateDiscount(price float64, customerType string, seasonalPromo bool) float64 {
    discount := 0.0

    switch customerType {
    case "premium":
        discount = 0.20
    case "gold":
        discount = 0.15
    case "regular":
        discount = 0.10
    }

    if seasonalPromo {
        discount += 0.05
    }

    return price * (1 - discount)
}

// Less critical: Simple getter
func (u *User) GetName() string {
    return u.name
}
2. Use Table-Driven Tests
Table-driven tests improve coverage and reduce duplication:
func TestCalculateDiscount(t *testing.T) {
    tests := []struct {
        name         string
        price        float64
        customerType string
        seasonalPromo bool
        want         float64
    }{
        {
            name:         "premium customer with promo",
            price:        100.0,
            customerType: "premium",
            seasonalPromo: true,
            want:         75.0,
        },
        {
            name:         "regular customer no promo",
            price:        100.0,
            customerType: "regular",
            seasonalPromo: false,
            want:         90.0,
        },
        {
            name:         "gold customer with promo",
            price:        100.0,
            customerType: "gold",
            seasonalPromo: true,
            want:         80.0,
        },
    }

    for _, tt := range tests {
        t.Run(tt.name, func(t *testing.T) {
            got := CalculateDiscount(tt.price, tt.customerType, tt.seasonalPromo)
            if got != tt.want {
                t.Errorf("CalculateDiscount() = %v, want %v", got, tt.want)
            }
        })
    }
}
Benefits:
- Easy to add new test cases
- Clear test structure
- Better failure messages with
t.Run() - Covers multiple scenarios efficiently
3. Test Error Paths
Error handling often gets missed in coverage. Make sure to test:
func ReadConfig(path string) (*Config, error) {
    data, err := os.ReadFile(path)
    if err != nil {
        return nil, fmt.Errorf("failed to read config: %w", err)
    }

    var config Config
    if err := json.Unmarshal(data, &config); err != nil {
        return nil, fmt.Errorf("failed to parse config: %w", err)
    }

    if err := config.Validate(); err != nil {
        return nil, fmt.Errorf("invalid config: %w", err)
    }

    return &config, nil
}

// Test all error paths
func TestReadConfig(t *testing.T) {
    t.Run("success", func(t *testing.T) {
        config, err := ReadConfig("testdata/valid.json")
        if err != nil {
            t.Fatalf("unexpected error: %v", err)
        }
        // assertions...
    })

    t.Run("file not found", func(t *testing.T) {
        _, err := ReadConfig("nonexistent.json")
        if err == nil {
            t.Fatal("expected error, got nil")
        }
    })

    t.Run("invalid json", func(t *testing.T) {
        _, err := ReadConfig("testdata/invalid.json")
        if err == nil {
            t.Fatal("expected error, got nil")
        }
    })

    t.Run("validation failure", func(t *testing.T) {
        _, err := ReadConfig("testdata/invalid-schema.json")
        if err == nil {
            t.Fatal("expected error, got nil")
        }
    })
}
4. Use Subtests for Better Organization
Subtests improve coverage reporting and allow running specific tests:
func TestUserService(t *testing.T) {
    t.Run("CreateUser", func(t *testing.T) {
        t.Run("valid input", func(t *testing.T) {
            // test valid case
        })

        t.Run("duplicate email", func(t *testing.T) {
            // test duplicate detection
        })

        t.Run("invalid email format", func(t *testing.T) {
            // test validation
        })
    })

    t.Run("GetUser", func(t *testing.T) {
        t.Run("existing user", func(t *testing.T) {
            // test retrieval
        })

        t.Run("non-existent user", func(t *testing.T) {
            // test not found case
        })
    })
}
Run specific subtests:
# Run all CreateUser tests
go test -run TestUserService/CreateUser

# Run specific subtest
go test -run TestUserService/CreateUser/valid_input
5. Exclude Generated and Vendor Code
Keep your coverage metrics focused on your code:
Option 1: Test only your packages
go test -coverprofile=coverage.out ./...
Option 2: Exclude specific directories
Create a script or Makefile:
# Exclude vendor and generated code
go test -coverprofile=coverage.out \
  $(go list ./... | grep -v /vendor/ | grep -v /mocks/)
Option 3: Use build tags
Mark generated files:
//go:build !test

package generated

// This file is excluded from test builds
6. Set Coverage Thresholds
Prevent coverage from dropping by setting minimums in CI:
#!/bin/bash
# check-coverage.sh

COVERAGE=$(go test -coverprofile=coverage.out ./... | \
           grep "coverage:" | \
           awk '{print $2}' | \
           sed 's/%//')

THRESHOLD=80

if (( $(echo "$COVERAGE < $THRESHOLD" | bc -l) )); then
    echo "Coverage $COVERAGE% is below threshold $THRESHOLD%"
    exit 1
fi

echo "Coverage $COVERAGE% meets threshold"
Add to GitHub Actions:
- name: Check coverage threshold
  run: |
    chmod +x ./check-coverage.sh
    ./check-coverage.sh
7. Review Coverage Reports Regularly
Make coverage review part of your continuous testing workflow:
- In Pull Requests: Check coverage changes before merging
- Weekly Reviews: Look for coverage trends
- Before Releases: Ensure critical paths are tested
- After Refactoring: Verify tests still cover refactored code
Advanced Coverage Techniques
Integration Test Coverage
Go 1.20+ supports coverage for integration tests. Perfect for testing full applications:
# Build your app with coverage
go build -cover -o myapp

# Run integration tests
GOCOVERDIR=/tmp/coverage ./myapp

# Generate report
go tool covdata textfmt -i=/tmp/coverage -o=integration-coverage.out
Combine with unit test coverage:
# Merge coverage profiles
go tool covdata merge \
  -i=/tmp/coverage,./unit-coverage \
  -o=./combined-coverage
Read more in the official Go blog post.
Coverage for HTTP Handlers
Test HTTP handlers effectively with httptest:
func TestHealthHandler(t *testing.T) {
    req := httptest.NewRequest("GET", "/health", nil)
    w := httptest.NewRecorder()

    HealthHandler(w, req)

    if w.Code != http.StatusOK {
        t.Errorf("expected status 200, got %d", w.Code)
    }

    expected := `{"status":"healthy"}`
    if w.Body.String() != expected {
        t.Errorf("expected %s, got %s", expected, w.Body.String())
    }
}
For frameworks like Gin:
func TestGinHandler(t *testing.T) {
    gin.SetMode(gin.TestMode)

    router := setupRouter()
    w := httptest.NewRecorder()
    req, _ := http.NewRequest("GET", "/api/users/123", nil)

    router.ServeHTTP(w, req)

    assert.Equal(t, 200, w.Code)
    // more assertions...
}
Testing with Mocks
Use interfaces and mocks for better coverage of edge cases:
// Define interface
type UserRepository interface {
    GetUser(id int) (*User, error)
    CreateUser(user *User) error
}

// Service uses interface
type UserService struct {
    repo UserRepository
}

// Mock for testing
type MockUserRepository struct {
    GetUserFunc    func(id int) (*User, error)
    CreateUserFunc func(user *User) error
}

func (m *MockUserRepository) GetUser(id int) (*User, error) {
    return m.GetUserFunc(id)
}

func (m *MockUserRepository) CreateUser(user *User) error {
    return m.CreateUserFunc(user)
}

// Test with mock
func TestUserService_GetUser(t *testing.T) {
    mock := &MockUserRepository{
        GetUserFunc: func(id int) (*User, error) {
            return &User{ID: id, Name: "Test"}, nil
        },
    }

    service := &UserService{repo: mock}
    user, err := service.GetUser(123)

    if err != nil {
        t.Fatalf("unexpected error: %v", err)
    }
    if user.ID != 123 {
        t.Errorf("expected ID 123, got %d", user.ID)
    }
}
Popular mocking frameworks:
- testify/mock - Most popular
- gomock - Official mock framework
- mockery - Mock generator
Troubleshooting Common Coverage Issues
Coverage File Not Generated
Problem: go test runs but no coverage file appears
Solutions:
# Verify tests are actually running
go test -v ./...

# Check you're in the right directory
pwd

# Use absolute path for coverage file
go test -coverprofile=/tmp/coverage.out ./...

# Check file permissions
ls -la coverage.out
Inaccurate Coverage Numbers
Problem: Coverage seems wrong or inconsistent
Solutions:
# Use atomic mode for parallel tests
go test -covermode=atomic -coverprofile=coverage.out ./...

# Run tests sequentially
go test -p 1 -coverprofile=coverage.out ./...

# Clear test cache
go clean -testcache
go test -coverprofile=coverage.out ./...
Coverage Too Low
Problem: Coverage is lower than expected
Common causes:
- Generated code included: Exclude generated files
- Integration tests not counted: Use Go 1.20+ integration coverage
- Init functions: These run before tests, often uncounted
- Build tags: Some code may not compile in test mode
Check what's uncovered:
# View HTML report
go tool cover -html=coverage.out

# Find uncovered functions
go tool cover -func=coverage.out | grep 0.0%
Import Cycle Errors
Problem: Tests cause import cycles
Solution: Use separate test packages:
// Instead of: package mypackage
package mypackage_test

import (
    "testing"
    "myproject/mypackage"
)

func TestSomething(t *testing.T) {
    result := mypackage.SomeFunction()
    // ...
}
Coverage Metrics to Track
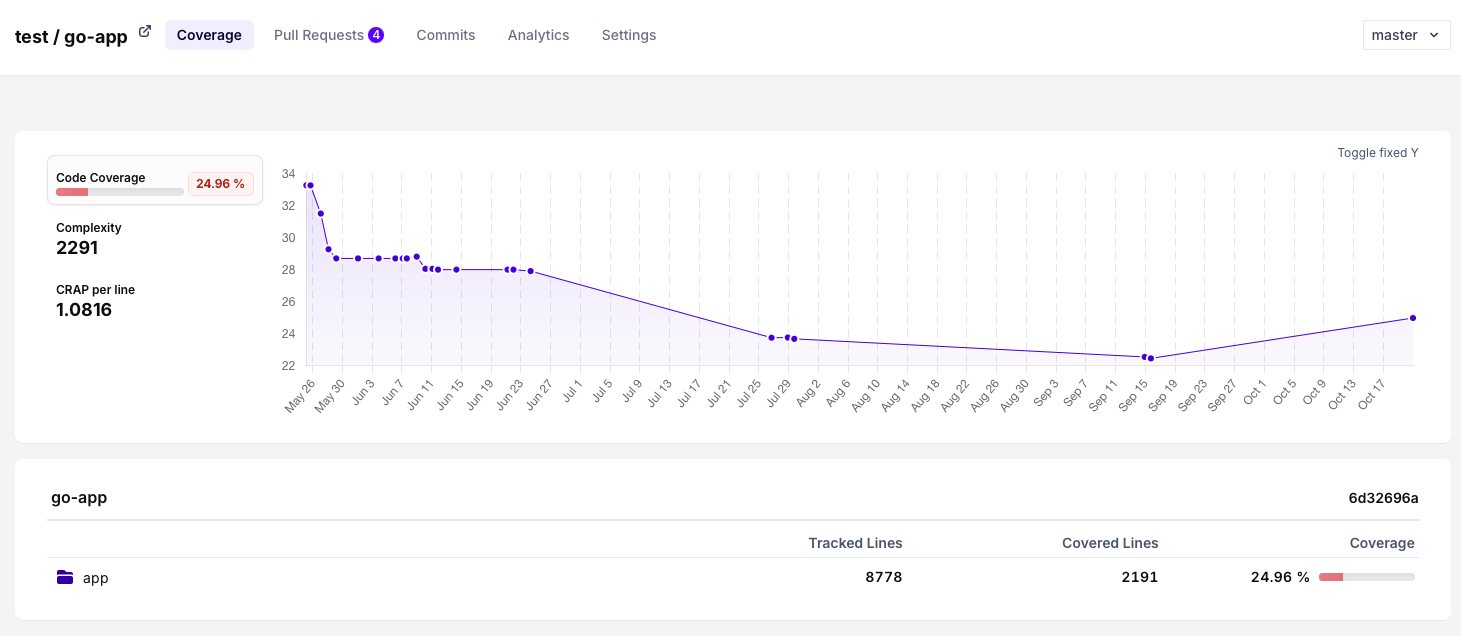
Beyond basic coverage percentage, track these metrics with OtterWise.
1. Coverage Trend
Track coverage over time to catch drops:
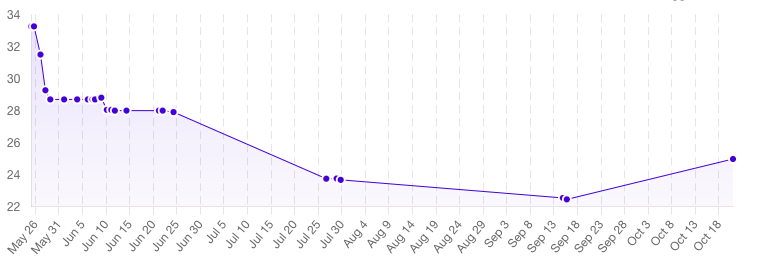
Watch for:
- Sudden drops (indicates untested code added)
- Gradual decline (tech debt accumulating)
- Plateaus (might be at natural coverage limit)
2. Package-Level Coverage
Identify which packages need attention:
# Show coverage per package
go test -coverprofile=coverage.out ./...
go tool cover -func=coverage.out | grep "total:"
3. Function Coverage
Find specific untested functions:
# List all functions with coverage
go tool cover -func=coverage.out

# Find completely untested functions
go tool cover -func=coverage.out | grep "0.0%"
4. Critical Path Coverage
Ensure business-critical code is well-tested with appropriate coverage thresholds:
- Payment processing: 95%+
- Authentication/Authorization: 90%+
- Data validation: 85%+
- Business logic: 80%+
- Utilities: 70%+
5. PR Coverage Delta
Track coverage changes in pull requests:
- name: Compare coverage
  run: |
    # Get base branch coverage
    git checkout main
    go test -coverprofile=base-coverage.out ./...
    BASE_COV=$(go tool cover -func=base-coverage.out | grep total | awk '{print $3}')

    # Get PR coverage
    git checkout -
    go test -coverprofile=pr-coverage.out ./...
    PR_COV=$(go tool cover -func=pr-coverage.out | grep total | awk '{print $3}')

    echo "Base coverage: $BASE_COV"
    echo "PR coverage: $PR_COV"
Monitor your test quality
With OtterWise, you can track Code Coverage, contributor stats, code quality, and much more.
Free for open source
Tools and Integrations
VS Code Extension
Get real-time coverage in your editor:
- Install Go extension
- Run tests with coverage:
Cmd+Shift+P→ "Go: Test Coverage In Current Package" - See green (covered) and red (uncovered) highlighting inline
GoLand/IntelliJ
JetBrains IDEs have built-in coverage:
- Run tests with coverage: Click the coverage button
- View coverage in editor with highlighting
- See coverage report in tool window
Makefile Targets
Simplify coverage commands:
.PHONY: test coverage coverage-html coverage-func clean

test:
	go test -v -race ./...

coverage:
	go test -coverprofile=coverage.out -covermode=atomic ./...

coverage-html: coverage
	go tool cover -html=coverage.out -o coverage.html
	@echo "Coverage report: coverage.html"

coverage-func: coverage
	go tool cover -func=coverage.out

clean:
	rm -f coverage.out coverage.html

# Combined target
test-coverage: coverage coverage-html
	@echo "Tests complete with coverage report"
Usage:
make test-coverage
Pre-Commit Hooks
Prevent commits that drop coverage:
Create .git/hooks/pre-push:
#!/bin/bash

echo "Checking test coverage..."

# Run tests with coverage
go test -coverprofile=coverage.out ./... > /dev/null 2>&1

if [ $? -ne 0 ]; then
    echo "Tests failed. Push aborted."
    exit 1
fi

# Get coverage percentage
COVERAGE=$(go tool cover -func=coverage.out | grep total | awk '{print $3}' | sed 's/%//')

# Set minimum threshold
THRESHOLD=75

if (( $(echo "$COVERAGE < $THRESHOLD" | bc -l) )); then
    echo "Coverage $COVERAGE% is below threshold $THRESHOLD%"
    echo "Push aborted."
    exit 1
fi

echo "Coverage $COVERAGE% - OK"
exit 0
Make executable:
chmod +x .git/hooks/pre-push
Conclusion
Tracking code coverage in Go is straightforward thanks to native tooling. Here's what we covered:
- Built-in Coverage: Go's native support makes tracking easy
- Three Modes: Set, count, and atomic for different needs
- CI/CD Integration: Automate coverage tracking in GitHub Actions
- Best Practices: Focus on meaningful coverage, use table-driven tests
- Advanced Techniques: Integration tests, mocks, and HTTP testing
- Monitoring: Track trends, set thresholds, review regularly
Remember: Coverage is a tool, not a goal. Use it to:
- Find untested code
- Prevent regressions
- Build confidence in refactoring
- Maintain quality standards
Don't just chase high numbers. Focus on testing what matters: business logic, error paths, and edge cases.
Tools like OtterWise make it easy to track coverage across your team and projects, with automatic reporting and PR comments showing coverage changes. But the fundamentals remain the same: write good tests, track coverage, and continuously improve.
For complete Go language documentation and setup instructions, see our Go Setup Guide.
Official Go documentation on testing provides comprehensive details on the testing package.
For more on coverage in Go, check out:
Happy testing! 🧪
Related Resources
Want to learn more about code coverage and testing? Check out these helpful guides:
- Understanding Code Coverage - Learn the fundamentals of code coverage
- Test Coverage vs Code Coverage - Understanding the difference
- CI/CD Integration Guide - Automate your testing workflow
- GitHub Actions Setup - Complete CI/CD setup guide
- Pull Request Comments - See coverage changes in PRs
- Status Checks - Enforce coverage thresholds
- Coverage Badges - Display your coverage status
- Supported Formats - All coverage formats we support
- Coverage Thresholds - Setting meaningful coverage goals
- Continuous Testing - Build testing into your workflow
FAQs
What is a good code coverage percentage for Go projects?
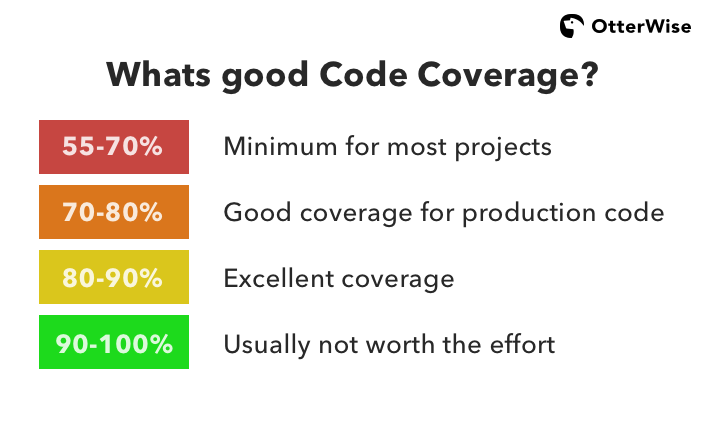
There's no universal "perfect" coverage number, but here are practical coverage guidelines:
General targets:
- 55-70%: Minimum for most projects
- 70-80%: Good coverage for production code
- 80-90%: Excellent coverage
- 90-100%: Usually not worth the effort
By component type:
- Critical business logic: 85-95%
- APIs and handlers: 75-85%
- Utilities and helpers: 70-80%
- Generated code: Not measured
- Simple getters/setters: 50-60% or skip
The Go standard library averages around 75-80% code coverage, which is a reasonable target. Focus on testing important code paths rather than chasing 100%.
How do I run coverage for a specific package in Go?
To run coverage for a specific package:
# Single package
go test -coverprofile=coverage.out ./pkg/mypackage

# Package and subpackages
go test -coverprofile=coverage.out ./pkg/mypackage/...

# View results
go tool cover -func=coverage.out
For multiple specific packages:
go test -coverprofile=coverage.out ./pkg/auth ./pkg/db ./pkg/api
To exclude packages:
# Exclude vendor and mocks
go test -coverprofile=coverage.out \
  $(go list ./... | grep -v /vendor/ | grep -v /mocks/)
Can I combine coverage from unit and integration tests?
Yes! Go 1.20+ supports merging coverage from different test runs:
Step 1: Generate unit test coverage
go test -coverprofile=unit-coverage.out ./...
Step 2: Generate integration test coverage
# Build app with coverage
go build -cover -o myapp

# Run integration tests
GOCOVERDIR=./coverage-integration ./myapp

# Convert to profile
go tool covdata textfmt \
  -i=./coverage-integration \
  -o=integration-coverage.out
Step 3: Merge profiles
Unfortunately, Go doesn't have a built-in merge command for profiles. Use a tool like gocovmerge:
go install github.com/wadey/gocovmerge@latest
gocovmerge unit-coverage.out integration-coverage.out > combined-coverage.out
Or use go tool covdata merge with raw coverage data:
go tool covdata merge \
  -i=./coverage-unit,./coverage-integration \
  -o=./coverage-combined
This gives you a complete picture of your test coverage across all test types.
