Changelog
A peek into what's been going on in the OtterWise product development department. We publish changelogs for even the smaller updates, in an effort to stay transparent.
Improved Reliability and fewer comments
Improved reliability when updating status checks for GitHub status checks, occassionally due to timeouts would not manage to get set.
Fixed: Sometimes you would see the OtterWise Otto PR comment repeated rather than updated. We attempt to always update rather than creating a new one for repeated coverage uploads, however the approach we used was during a different time. In short, we would pull the latest comments on a PR and look for the OtterWise one in that list, update if found, however this was not only inefficient and slow, but also meant that PRs with many comments (AI agents especially like to write a lot of them) would lose the OtterWise comment in the pile. This has been fixed for future PRs.
Path coverage, and branch coverage from LCOV
We now show path coverage for reports from Pebble with
--path-coverage. A path is one route through a method, so path coverage tells you whether each combination of branches ran. It is low by nature, often about 5%, so it is shown next to Code Coverage and Branch Coverage and does not change them or your status checks. Read the path coverage docs.You can find path coverage in these places, when your reports include it: a Path Coverage tile on the repository, commit and pull request pages, a path coverage line in the coverage chart (click the tile), a Paths column in the file list, a Paths row in the pull request comment, and the paths taken on each method in the file viewer, for example
Paths 1/2. The method badge now sits on the line that declares the method.With
--path-coverage, Pebble also writes how many outcomes of each decision ran. The file viewer marks the lines where only some outcomes ran as partly covered, so you can see where the missing paths are.LCOV reports now give branch coverage too, per file and per line, from their
BRDArecords. Istanbul-based tools (Jest, Vitest, nyc, c8) write these by default. For LCOV,clover_coveragein the API and analytics was always 100%, because LCOV has no statements. It now counts each line as a statement, so it is the share of lines and branches covered, as for Clover.The API now returns path coverage:
path_coverage,paths_totalandpaths_coveredon commits,pathin the repository coverage overview, andmethods(branch rate and paths per method) in the file coverage endpoints.
Branch coverage
We now show branch coverage next to line coverage. Line coverage tells you whether a line ran. Branch coverage tells you whether every outcome of a decision ran, for example both sides of an
if. There is nothing to turn on in OtterWise: if your Clover or Cobertura report has branch data, we read it on every upload. Line coverage stays the main Code Coverage number, and status checks still use it. Read the branch coverage docs to see which tools write branch data and how to enable it.You can find branch coverage in these places, when your reports include it: a Branches column in the file list, a Branch Coverage tile on the repository, commit and pull request pages, a branch coverage line in the coverage chart (click the tile), a Branches row in the pull request comment, and a Branch Coverage option for the dashboard statistics. Where we can compare with a base, we also show the change.
The file viewer now marks lines that ran but did not take all of their branches as partly covered, in amber. Hover over the line number to see, for example, "1 of 2 branches covered". Partly covered lines have their own counter and jump buttons at the top of the file, and their own color in the minimap. For Cobertura reports with method data, each method also shows its branch coverage.
Per-line branch data needs a report that writes it: Cobertura from coverage.py, Istanbul (Jest, Vitest, nyc, c8), gcovr and Coverlet, or Clover from Istanbul. PHPUnit and Pest write branch data per file (Clover) or as rates per file and method (Cobertura), but not per line. Files without branch data show "—", not 0% or 100%.
The API now returns branch coverage too:
branch_coverage,branches_totalandbranches_coveredon commits,branchin the repository coverage overview,branch_coveragein analytics trends, and per-linebranchesin the file coverage endpoints.
Track average patch coverage over time
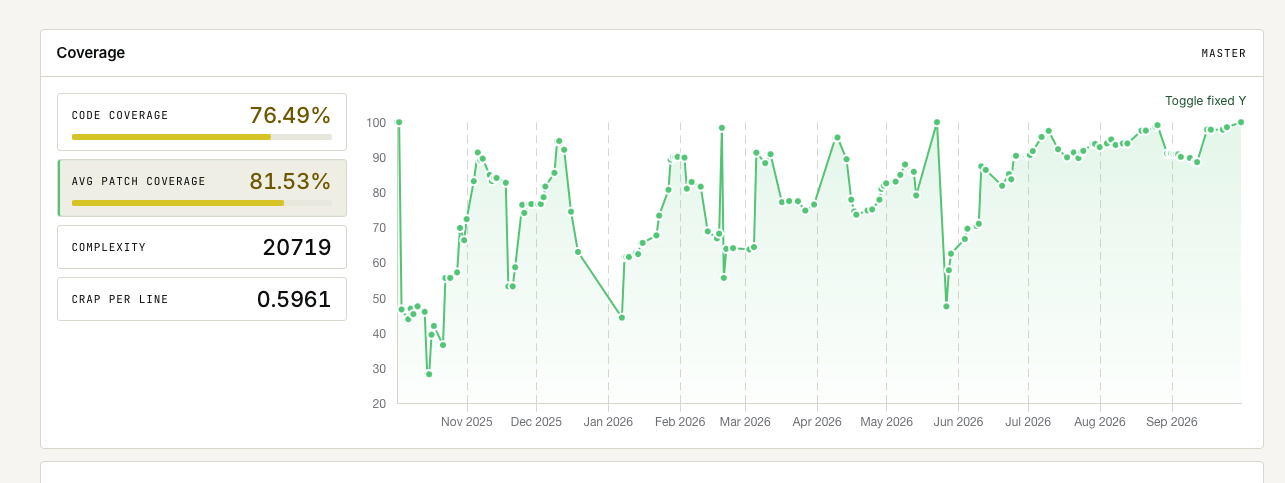
The repository page has a new Avg Patch Coverage tile. It shows the covered changed lines out of all changed lines for the full period of the coverage chart. Click it to show patch coverage over time in the chart. Each point in the chart shows the covered changed lines out of all changed lines in the 14 days up to that commit, so one small commit cannot move the line much. Commits that change no lines are skipped. Use it to see whether new code arrives with tests, for example after your team starts to use AI coding agents. The metric tiles beside the chart are also more compact now.
Redesigned Leaderboard
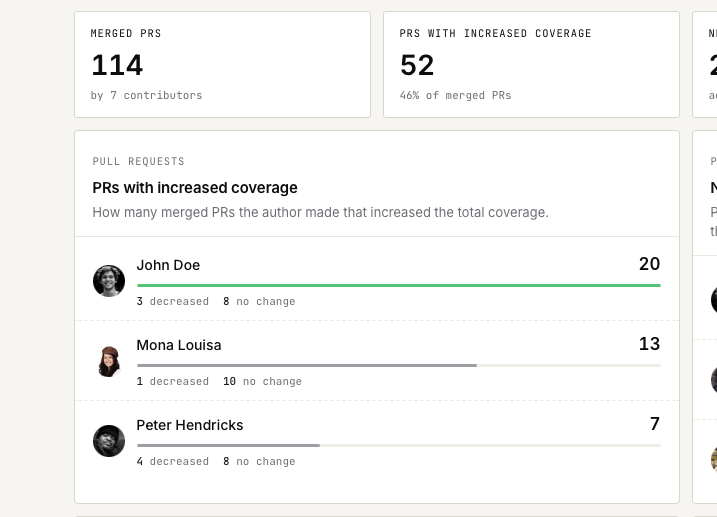
The leaderboard has been redesigned, giving it new life; a clearer hierachy, new filtering (show top 3 or everyone), added statistics as well as tidied up the visuals. This is part of an ongoing effort to improve the user experience of the OtterWise dashboard. As with everything, feel free to reach out to us on the support chat, or email, with suggestions or issues.
Clover reports from PHPUnit 11 and 12 are read in full
Fixed: We skipped some files in Clover reports from PHPUnit 11 and 12 (Pest 3 and 4). These versions put a file into a package only when it declares a class or trait in a namespace. Other files, such as route files, helper files, interfaces and enums, go directly into the report next to the packages. When a report had packages, we read only the files inside them. The skipped files were missing from your file list, and their lines were not in your coverage percentage. We now read every file in the report. If your coverage includes route or helper files, your next upload can show a different coverage percentage, because those lines now count. Reports from PHPUnit 9 and 10 are not affected.
The Coverage Change check no longer keeps an old value
Fixed: The Coverage Change status check could keep the value from an earlier upload. When a commit ended with the same coverage as its base, or when there was no base coverage to compare against, we posted no status at all. GitHub keeps the last status it received for a check, so an earlier, partial upload left a decrease standing on a commit that had not changed. We now always post this check: it reports
0.00%when nothing changed, and says so when there is no base coverage.
See your codebase grow in Analytics
Repository Analytics has a new Codebase Growth chart. It plots the tracked lines of code on your default branch over time, on the same date range and interval as the coverage chart on the repository page, so you can put a coverage trend next to the size of the codebase behind it. Only the lines your coverage reports include are counted, and each point tells you the file count and the commit it comes from.
Status checks now agree with the pull request comment
Fixed: The coverage status checks on a commit could report a different number than the coverage comment on the same pull request. A status was built from a single coverage report, while the comment uses the whole commit. So if you upload more than one flag or component per commit, or you use carry-forward, the status measured only part of your coverage but compared it against a complete base. For repositories that upload one flag per commit and carry the rest forward, this made the Coverage Change check fail on almost every pull request, whatever the pull request contained. Both now report the same number. We also write the status again as each upload arrives, so a commit built from several uploads settles on the complete figure.
Fixed: Patch coverage counted changed lines borrowed from your default branch. Carry-forward fills in the flags and components a commit did not upload, and those reports describe a different set of changes. Their changed lines were added to yours, so a pull request that changed 10 lines could be reported as changing several hundred, at a much lower percentage. Patch coverage now counts only the lines the commit itself changed, in the pull request comment, the status check and the dashboard. Overall coverage still includes carried-forward coverage, which is what the feature is for. Our earlier note said the Patch figure stayed reliable when carry-forward is enabled — that was not true, and it is now.
Fixed: The Coverage Change status check compared against the newest commit on your base branch, while the pull request comment compared against the commit your pull request is based on. When the base branch moved ahead, the two reported different changes for the same commit. Both now use the same commit: your pull request base when it has coverage, and the base branch when it does not — the comment already tells you when that happens.
Clearer coverage changes in pull requests
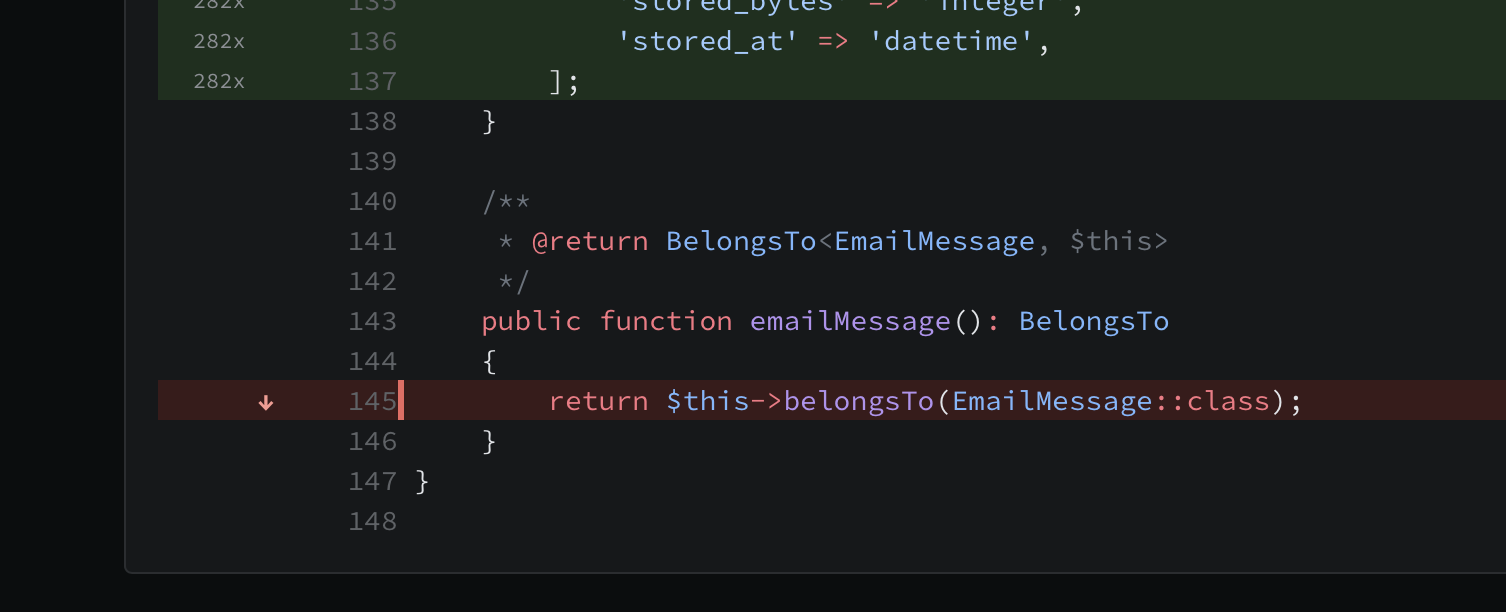
The file viewer now marks which lines gained or lost coverage since the base commit, not only which lines have coverage now. Each gets a counter and jump buttons at the top of the file. This also covers the files under "Unchanged files with coverage changes", where a test change flips coverage without the file itself changing.
The coverage comment we post on your pull requests now has a Covered Lines row. It shows how many lines your tests cover, so the table adds up to: Lines = Covered Lines + Misses. This is the number the Coverage percentage is calculated from.
Fixed: The Files with reduced coverage table in pull request comments listed files where the coverage percentage did not change at all. Deleting a few covered lines moves the coverage by less than the two decimals we show, so a file could be listed with a "-" change. Removing covered code is not a coverage regression, so these files are now left out.
Fixed: The Files with coverage changes and Unchanged files with coverage changes tabs only looked at the folder you had open, so from the top of a repository they usually showed nothing. Both tabs now look inside folders, and a folder is listed when a file below it matches. Keep in mind that the numbers on a folder row still count every file in it, not only the matching ones.
Sharper file rankings in Analytics and the Risk Report
The Complexity vs Coverage quadrant in Repository Analytics no longer flags very small files as hard to test. A two-line model at 0% coverage is cheap to cover and tells you little, so it no longer pushes real candidates down the list. The "Hard-to-Test Files" table is now ranked by payoff — how much untested, risky code each file holds — and shows an "Uncovered" column so you can see the ranking.
The Churn-Weighted Coverage Risk report now scales scores down for files that are almost fully covered, and for files too small to hold much risk. A large, busy file tested to 99% is not a testing priority, and it no longer reads as high risk. Your top rows now point at the files where tests will actually remove risk.
Contributors: More accurate "lines added" and a new "Uncovered lines added" column
The Contributors report now measures "Covered / Lines added" from the actual changes in each pull request (the diff) instead of subtracting whole-commit coverage totals. This makes the numbers reflect the lines a person really added or modified, and fixes wildly inflated figures for organizations using carry-forward flags/components (where a commit only uploads part of the coverage).
Added a new "Uncovered lines added" column to the Contributors report, showing how many of the lines each contributor added or modified are not covered by tests. It is measured from each pull request's diff, so it stays reliable even when carry-forward is enabled.
The "Uncovered lines removed" column now shows a note for organizations using carry-forward flags/components, explaining that it compares whole-commit coverage totals (which include coverage carried forward from the default branch) and can therefore be inaccurate — pointing to the new "Uncovered lines added" column as the reliable per–pull request figure.
For organizations using carry-forward flags/components, the pull request page, the repository pull request list, and the coverage comment posted to GitHub now flag that the base→head change (±) on Tracked Lines / Covered Lines / Misses compares whole-commit totals (which include carried-forward coverage) and can be inaccurate. The absolute numbers, Coverage and Patch Coverage remain reliable.
Fixed: Uploading an empty LCOV coverage report (one where the test run covered no files) would fail to process. These reports are now accepted and recorded correctly.
Fresh look and Dark Mode
Our whole app has gotten a visual refresh, including support for Dark Mode. This is a purely visual update — no functionality has changed, everything works exactly as it did before.
Dark Mode automatically follows your system/browser preference, so there is nothing to toggle.
This is still being tested, so if you run into anything that looks off or have any feedback, please let us know. We appreciate any and all findings.
Added search to the branch selector on the repository page, making it much easier to find the right branch on repositories with many branches.
Quick search with ⌘K / Ctrl+K
Added a quick search you can open anywhere in the app with ⌘K (Mac) or Ctrl+K (Windows/Linux). Start typing to instantly jump to any of your organizations, any repository across all your organizations, or common pages like Reporting, Billing, Settings and Team — only showing what you have access to.
Improved the reliability and speed of how we talk to GitHub behind the scenes. Sign-ins and data syncing are now smoother and less likely to be interrupted during busy periods.
Pull Requests: Browse commits and view coverage at any point
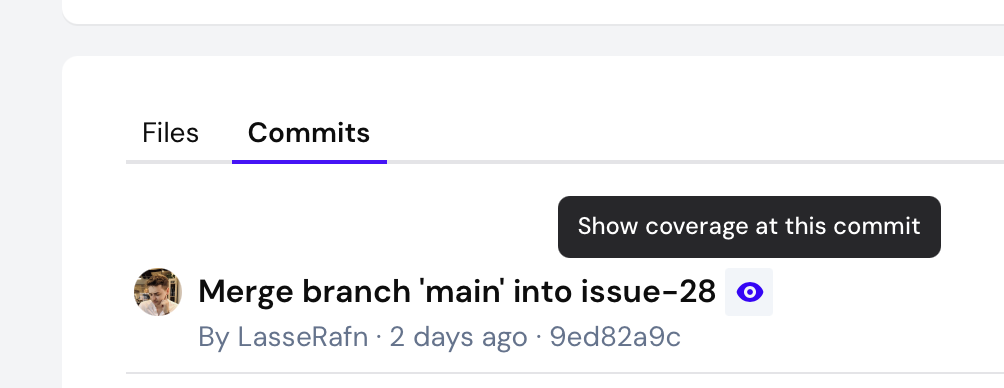
Added a "Commits" tab to the pull request view, listing all commits added to the head branch since the PR was opened, sorted most recent first. Each row shows author, short SHA, message, tracked/covered lines, coverage and patch coverage.
Added a "Show coverage at this commit" button next to each commit in the new tab. Selecting it loads the file tree, coverage stats and file viewer for that commit instead of the PR head, making it easier to compare how coverage evolved across review iterations. A dismissible banner makes the active commit clear and a single click resets back to the PR head.
Fixed: Coverage uploads could fail for repositories with very high execution hit counts (such as lines inside large loops). The internal counters have been widened to handle these cases.
Pull Requests: More Information and cleaner experience
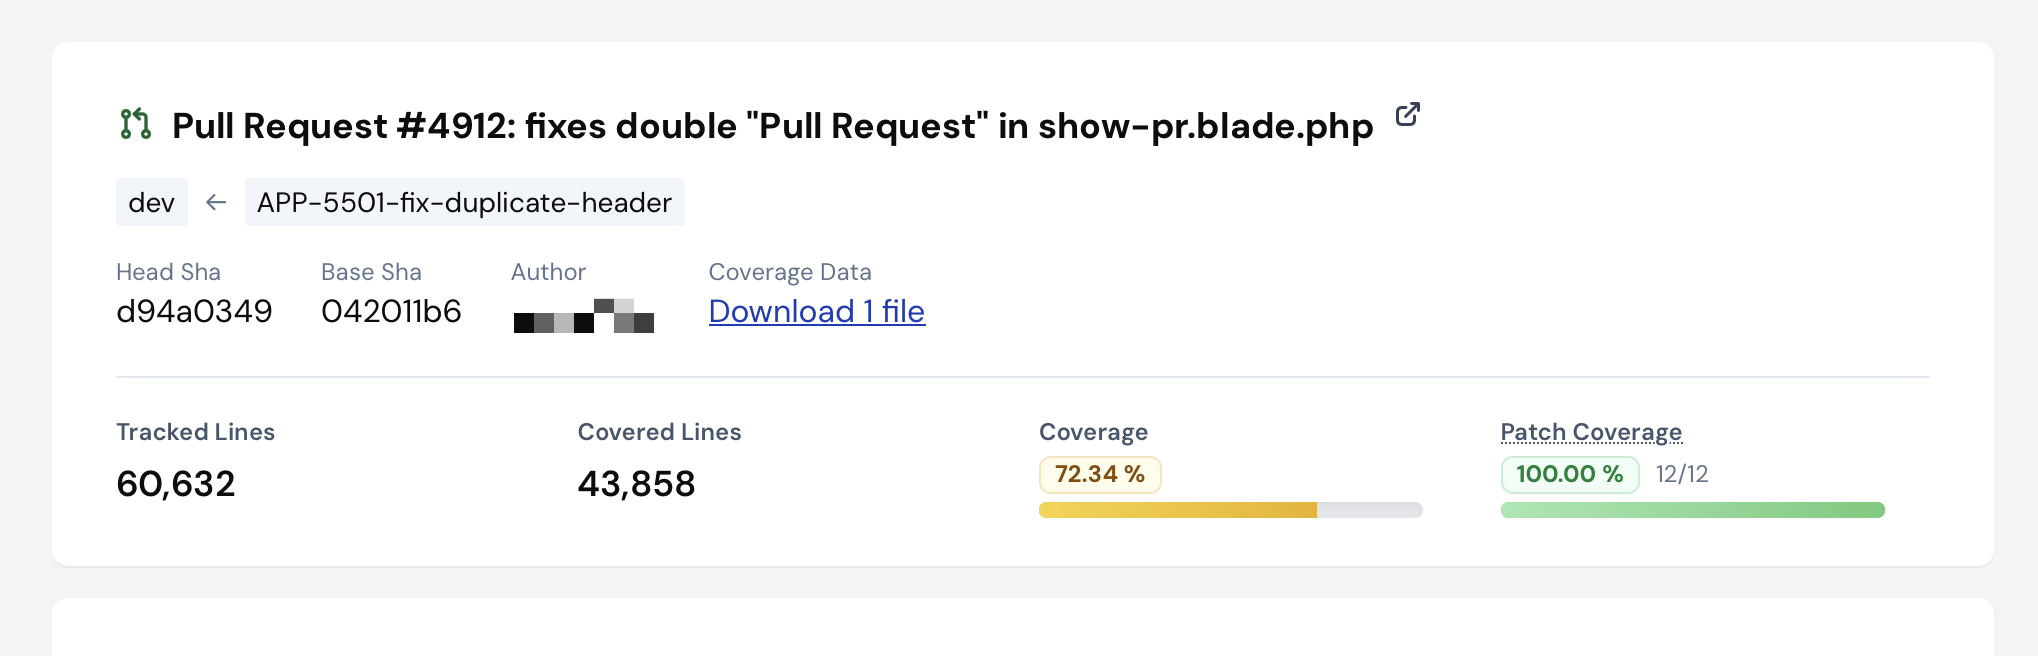
Added more information to the pull request view. This should hopefully make "View full report" more viable for usage during review time. Now includes tracked and covered lines, clearer coverage data, patch coverage, type coverage (when enabled), and deltas where relevant. You can now also see head and base branch as well as PR state (open, closed, ...).
Tightened spacing, cleaned up visuals for a better experience with large pull requests.
Fixed: "Pull Request" was repeated in the header.
Code Viewer: Added quick navigation
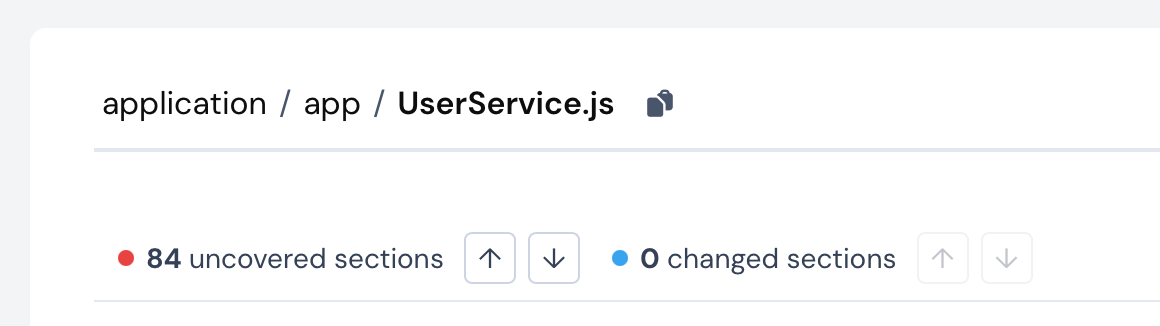
Added quick navigation arrows for uncovered lines of code, called "Sections". A section is when a group of lines are all not covered by tests, without any covered lines in-between them.
Added quick navigation arrows for changed lines when viewing files inside Pull Requests, to quickly hop between changed lines of code.
Fixed: In very rare instances, the file viewer for pull requests would not render diffs for private repositories.
Ship better code faster, with confidence.
PR comments, status checks, line annotations, and trends, all without code access. Free for public repos; per-repo pricing for private repos.
