Improvements
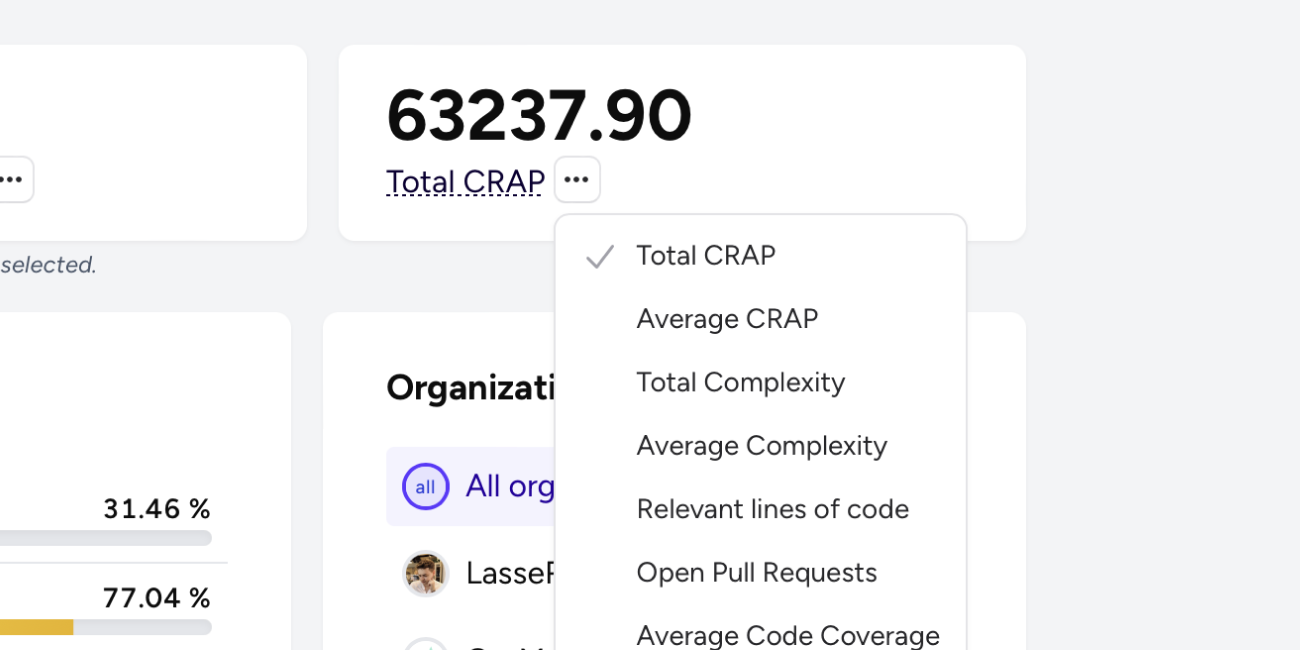
As mentioned in Changelog version 2024-09-03, the dashboard statistics included 4 values that were up for change based on user feedback. With the feedback given we have added the ability to change the statistics per block, as well as added new statistics blocks to choose from, such as total/average complexity, average CRAP and type coverage. The setting is persisted per user, so each of your team members can display their own preferred statistics.
Bugfixes
Fixed: Dashboard statistics would count averages including enabled repositories without any commits, which would skew the numbers, making coverage etc. appear much lower if your organization had enabled-but-unused repositories.
We regularly update our changelog in an effort to improve transparency into the development process. If you have any questions or feedback, please don't hesitate to contact us.
If you are a user of OtterWise already, or have been reading our blog, you might already know that we take privacy extremely serious, even when it comes to protecting your code as if it was sensitive personal information, this goes for everything we do, which is why we publish changelogs for even smaller updates, rather than just major releases.
Our weekly digest for OtterWise users also includes our changelog in the bottom (see related changelog), to keep you up-to-date with the latest changes.