Spot coverage gaps at a glance
Quickly identify files and directories with poor test coverage using our interactive treemap visualization. Large red blocks highlight areas with significant uncovered code that might need more attention.
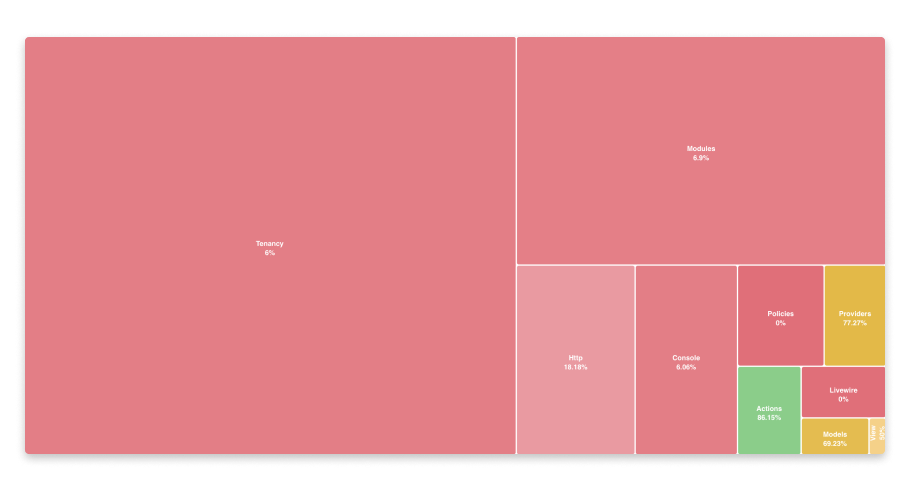
Our treemap visualization makes it easy to spot coverage problems in your codebase at a glance. Each block represents a file or directory, with:
- Size based on the amount of uncovered code
- Color indicating coverage percentage (red = low coverage, yellow = medium coverage, green = high coverage)
- Interactive navigation to drill down into directories by clicking
Large red blocks represent the biggest opportunities to improve your overall coverage. Click on any file to jump directly to its coverage details.
No credit card required for public repos.
Privacy by default
We never access your source. We only store coverage metrics and the minimal service data needed to run OtterWise. Read about our code privacy efforts.
Invite your entire team
All plans (including free) offer unlimited collaborators at no extra charge. You can invite your entire engineering department, designers, PMs, and stakeholders.
Track progress anywhere
Watch coverage move over time in the dashboard, or pull the same numbers into your own with the API.
Onboarding assistance
All paid plans include priority chat support, and we can help you get running even if you have no CI pipeline yet.
Tailored to your workflow
Configure which files to ignore, when to fail CI, how coverage is calculated, and more. It bends to your setup, not the other way around.
Surface the riskiest code
Per-line coverage, type coverage, and CRAP scores point you at the code most likely to break, so you test what matters first.
See exactly what your tests miss.
Free for public repos. Set up in 5 minutes. No credit card required.
Coverage trends
Track trends, spot wins, find gaps
See how coverage moves across every branch: who's pushing it up, where code is slipping through untested, and which trends to act on before they become problems.
#123 Add new feature for import & export of user data
$ curl -H "Authorization: Bearer ow_live_…" \
    https://otterwise.app/api/v1/repos/otter-test

{
  "repo": "otter-test",
  "branch": "main",
  "coverage": 82.6,
  "delta": 2.4,
  "lines": { "covered": 1061, "total": 1284 },
  "trend": "up"
}
API access
Your coverage data, one request away
A simple JSON API, included in every plan, with relaxed rate limits. Pull coverage, deltas, and trends into your own dashboards, scripts, or status pages.
Ship better code faster, with confidence.
PR comments, status checks, line annotations, and trends, all without code access. Free for public repos; per-repo pricing for private repos.
