Track average patch coverage over time
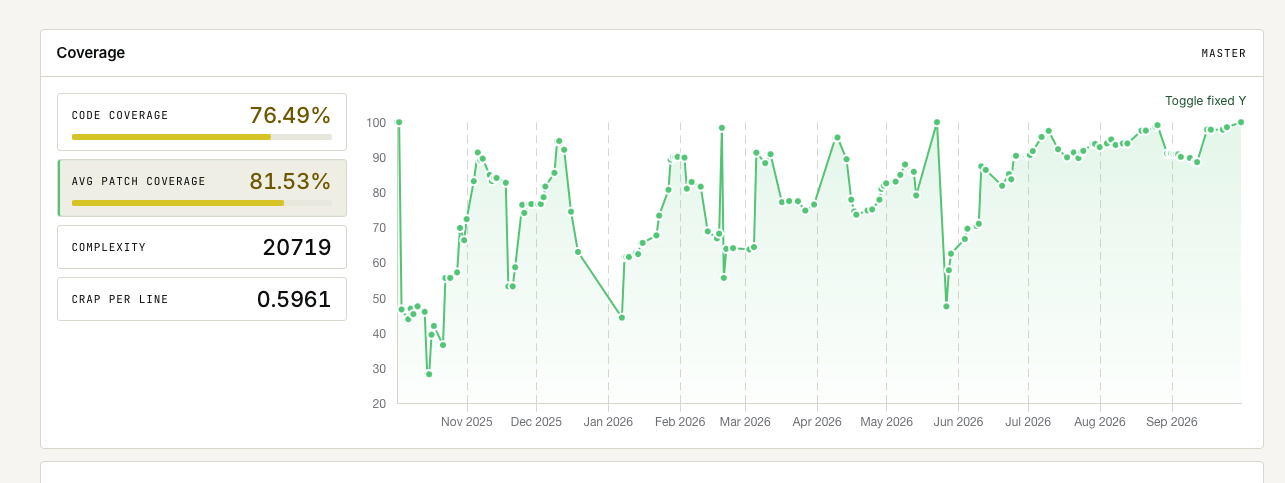
The repository page has a new Avg Patch Coverage tile. It shows the covered changed lines out of all changed lines for the full period of the coverage chart. Click it to show patch coverage over time in the chart. Each point in the chart shows the covered changed lines out of all changed lines in the 14 days up to that commit, so one small commit cannot move the line much. Commits that change no lines are skipped. Use it to see whether new code arrives with tests, for example after your team starts to use AI coding agents. The metric tiles beside the chart are also more compact now.
We regularly update our changelog in an effort to improve transparency into the development process. If you have any questions or feedback, please don't hesitate to contact us.
If you are a user of OtterWise already, or have been reading our blog, you might already know that we take privacy extremely serious, even when it comes to protecting your code as if it was sensitive personal information, this goes for everything we do, which is why we publish changelogs for even smaller updates, rather than just major releases.
Our weekly digest for OtterWise users also includes our changelog in the bottom (see related changelog), to keep you up-to-date with the latest changes.
Ship better code faster, with confidence.
PR comments, status checks, line annotations, and trends, all without code access. Free for public repos; per-repo pricing for private repos.
